Very Preliminary
QMUL, TSE and CEPR
Brown University
August 13, 2026

© Getty Images
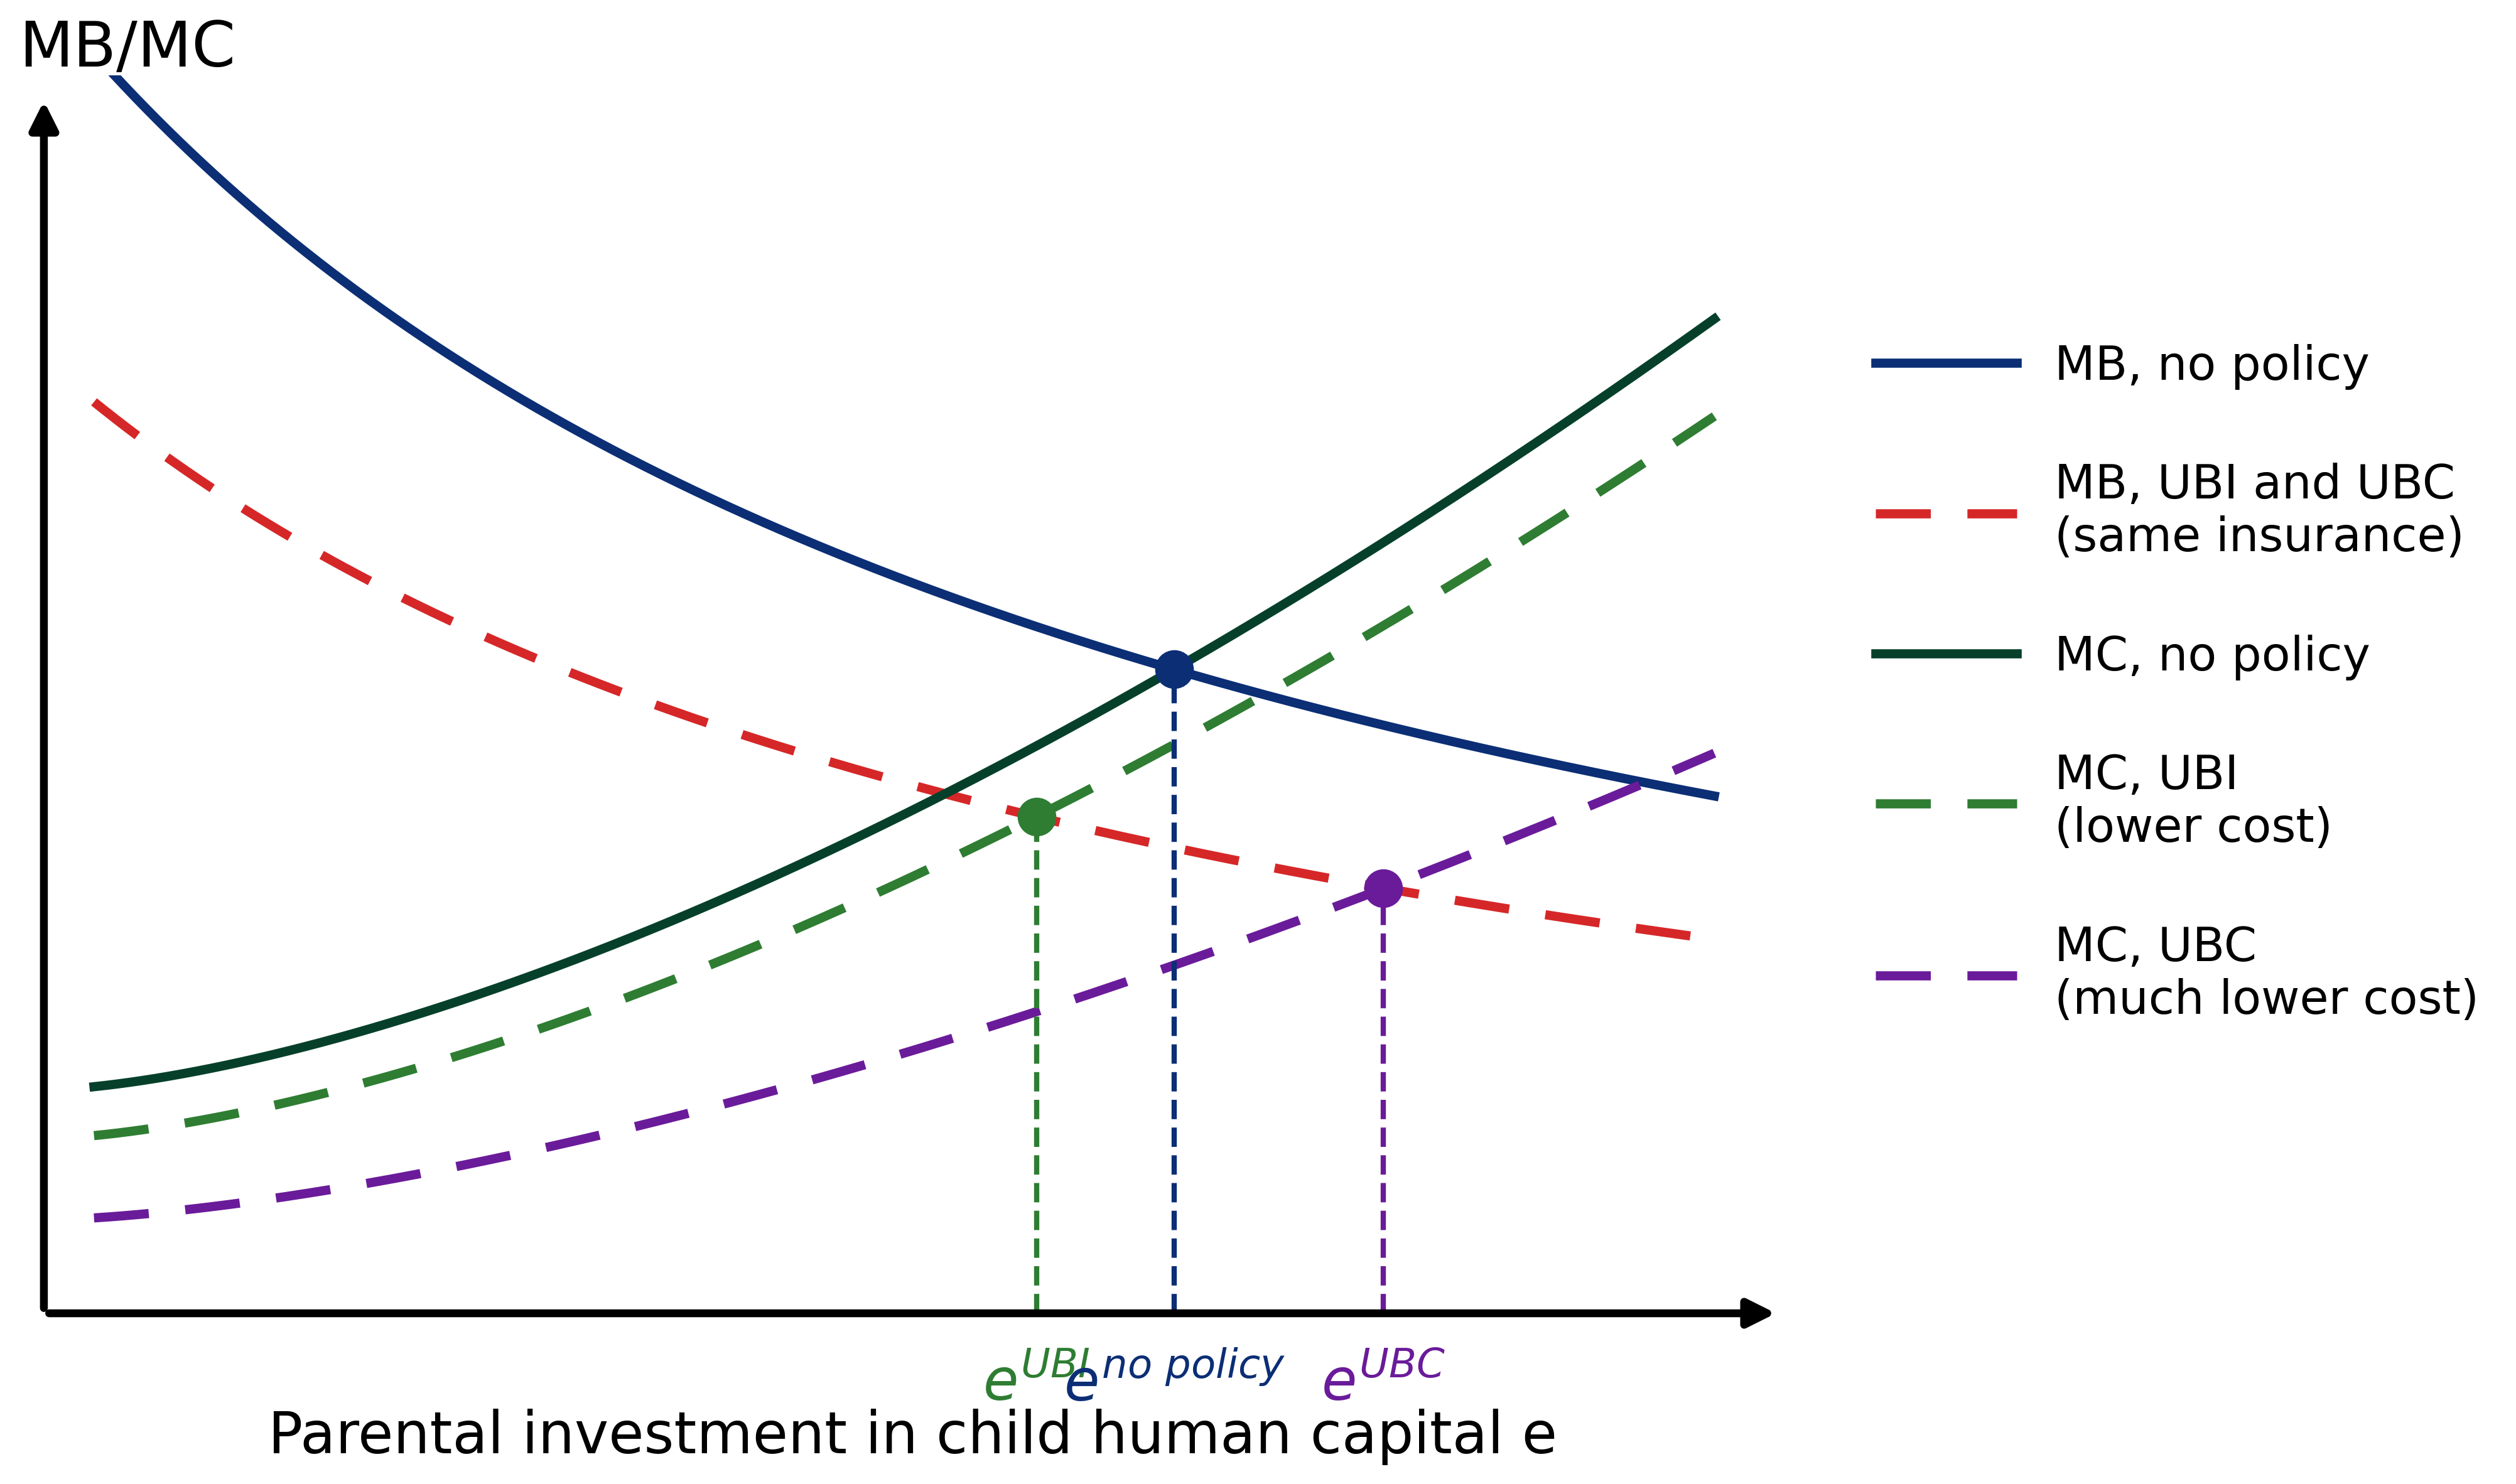
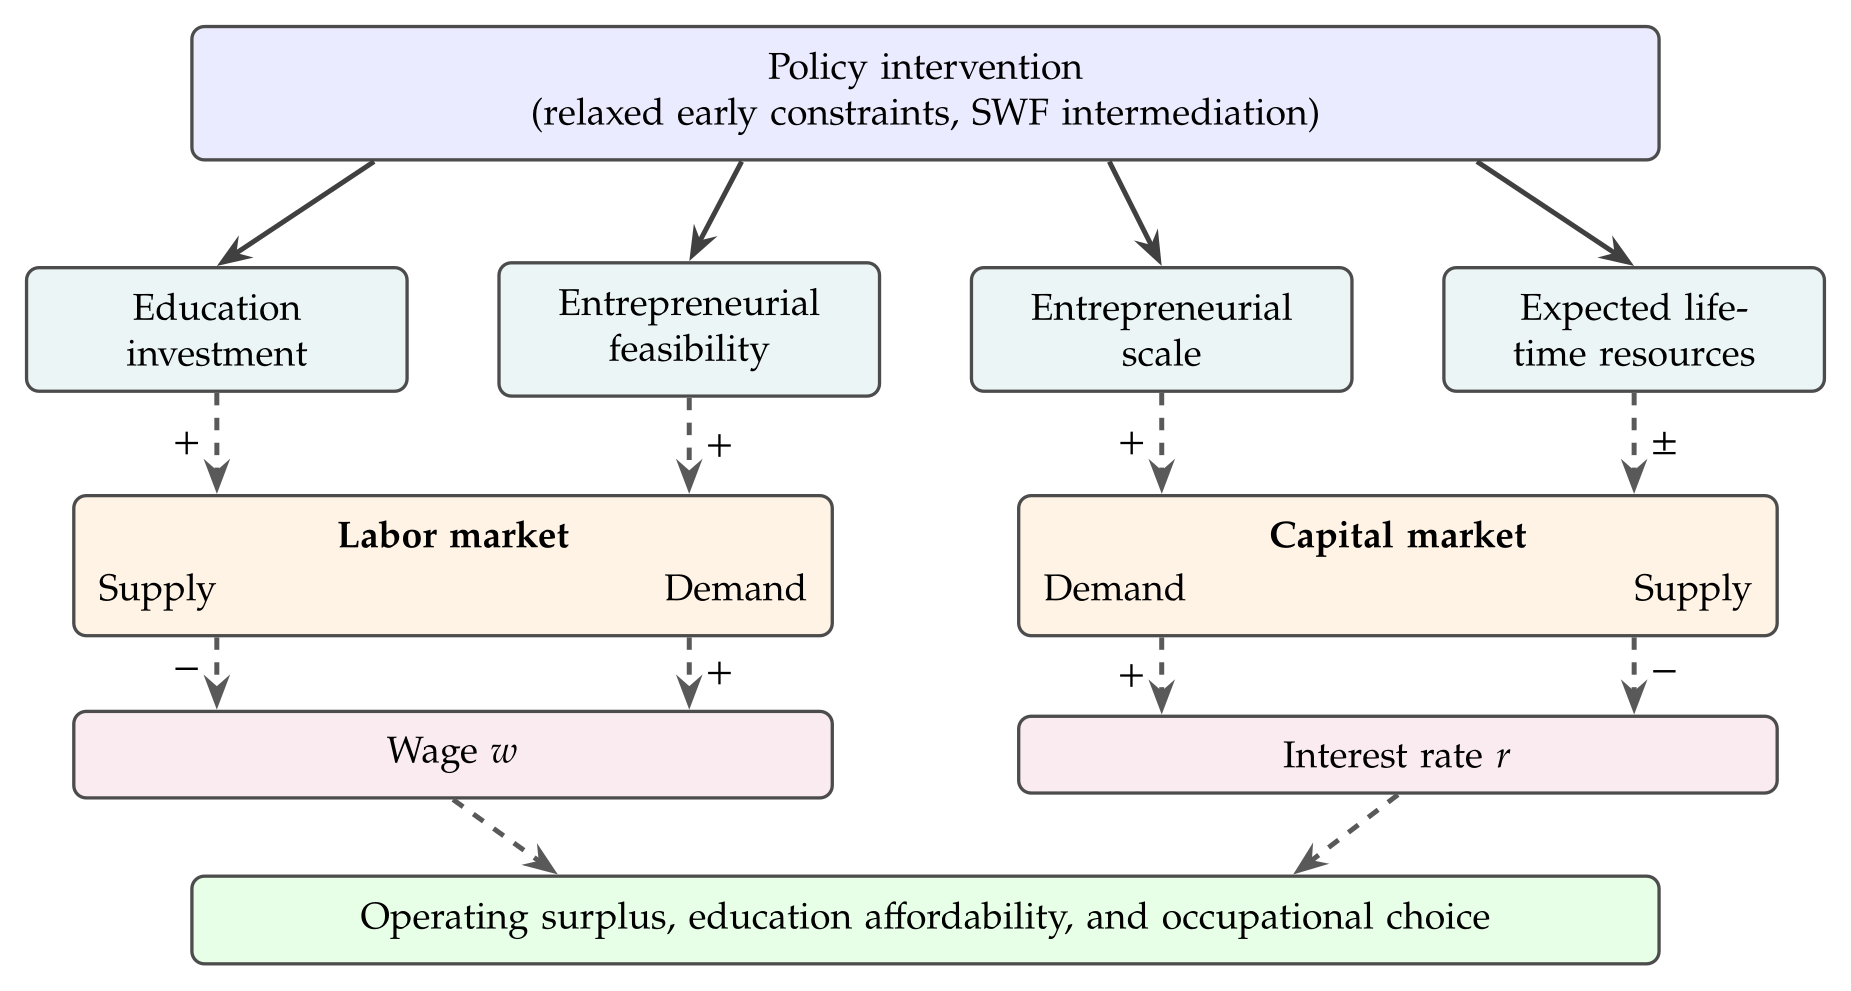
UBC: pledge future UBI at “early in life” decision nodes
SWF: returns from publicly owned business capital in lieu of distortionary taxation
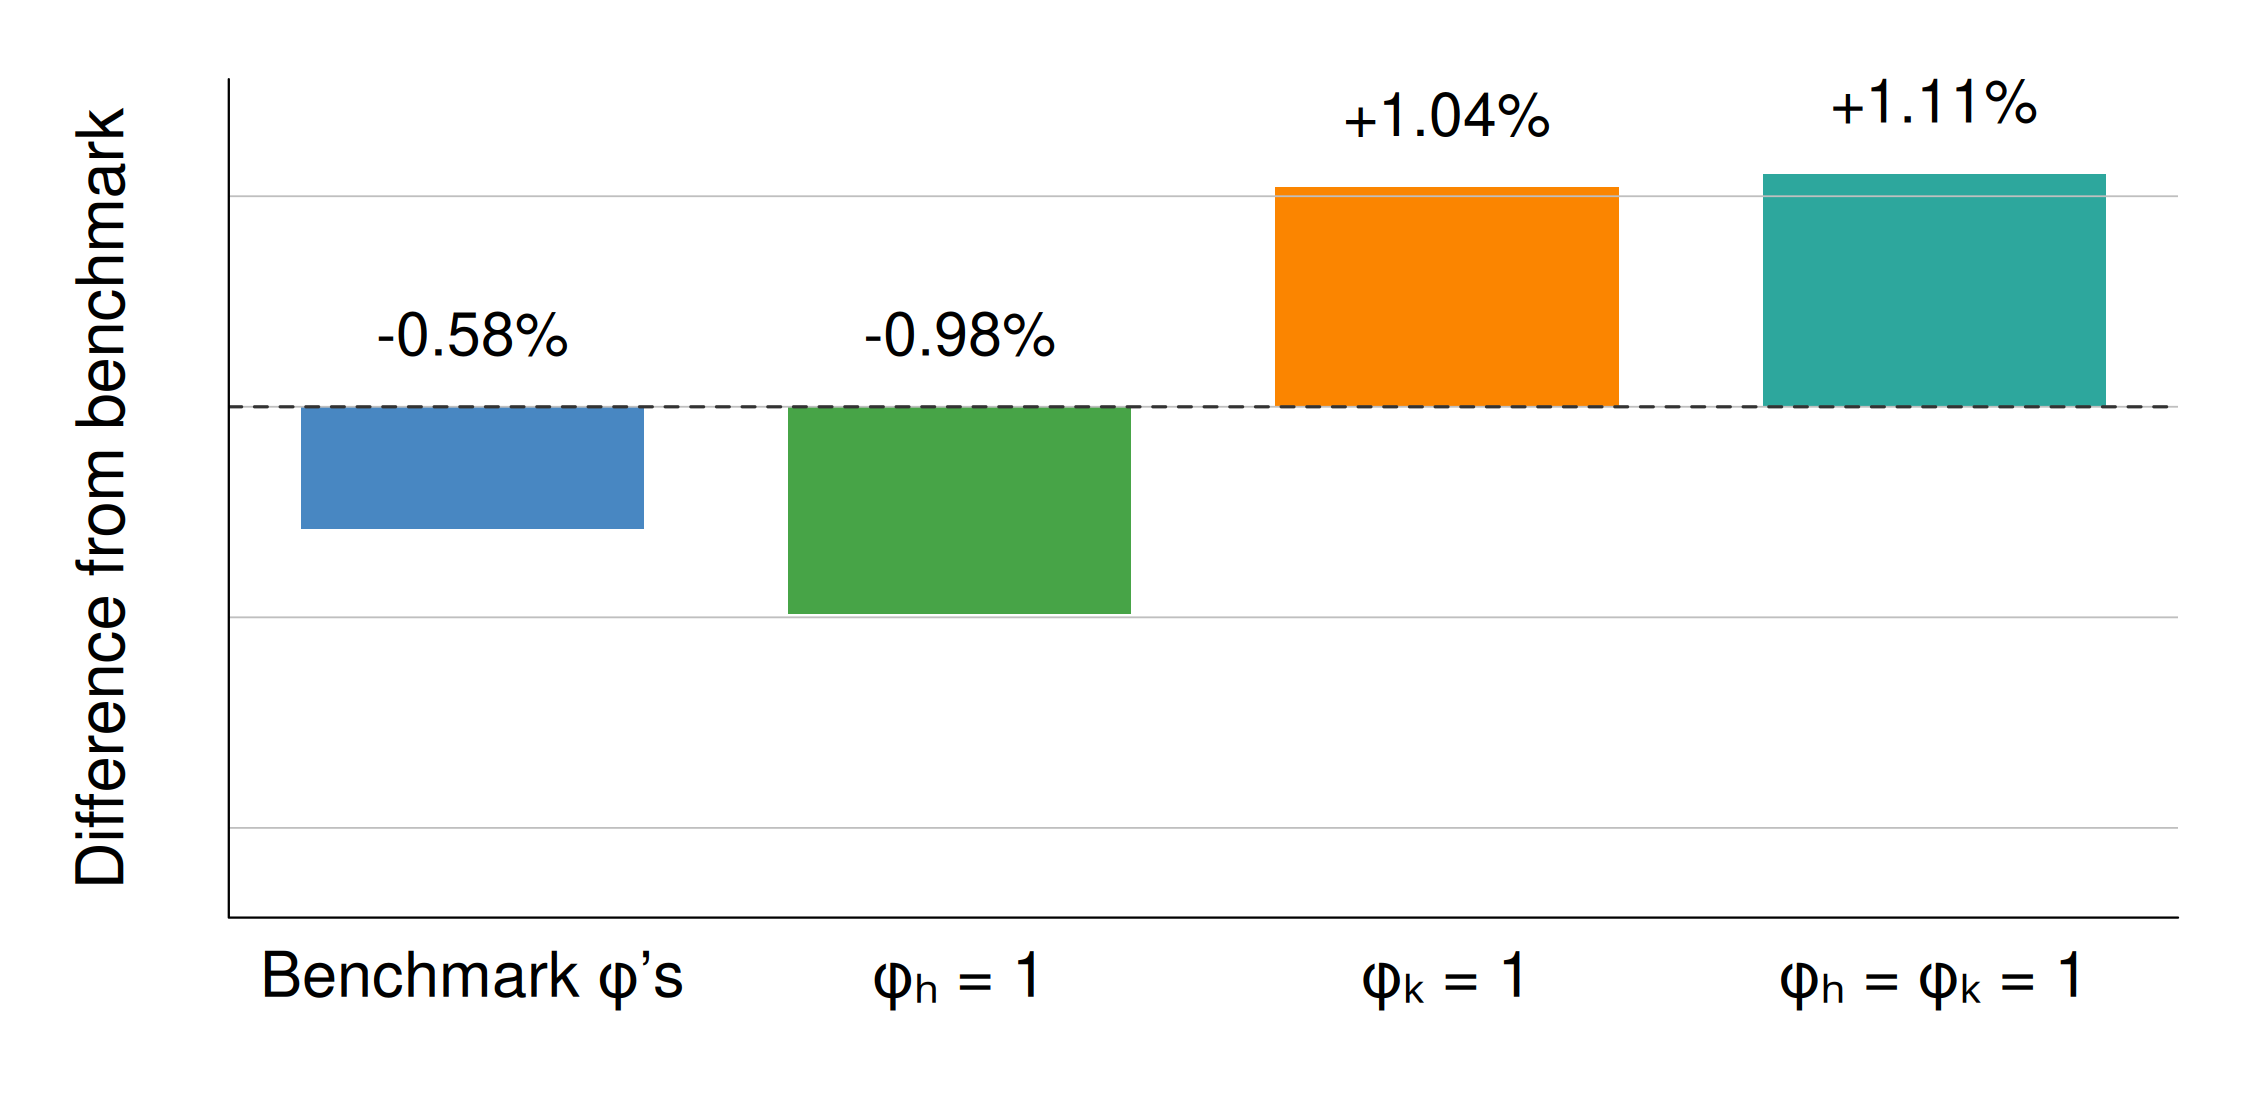
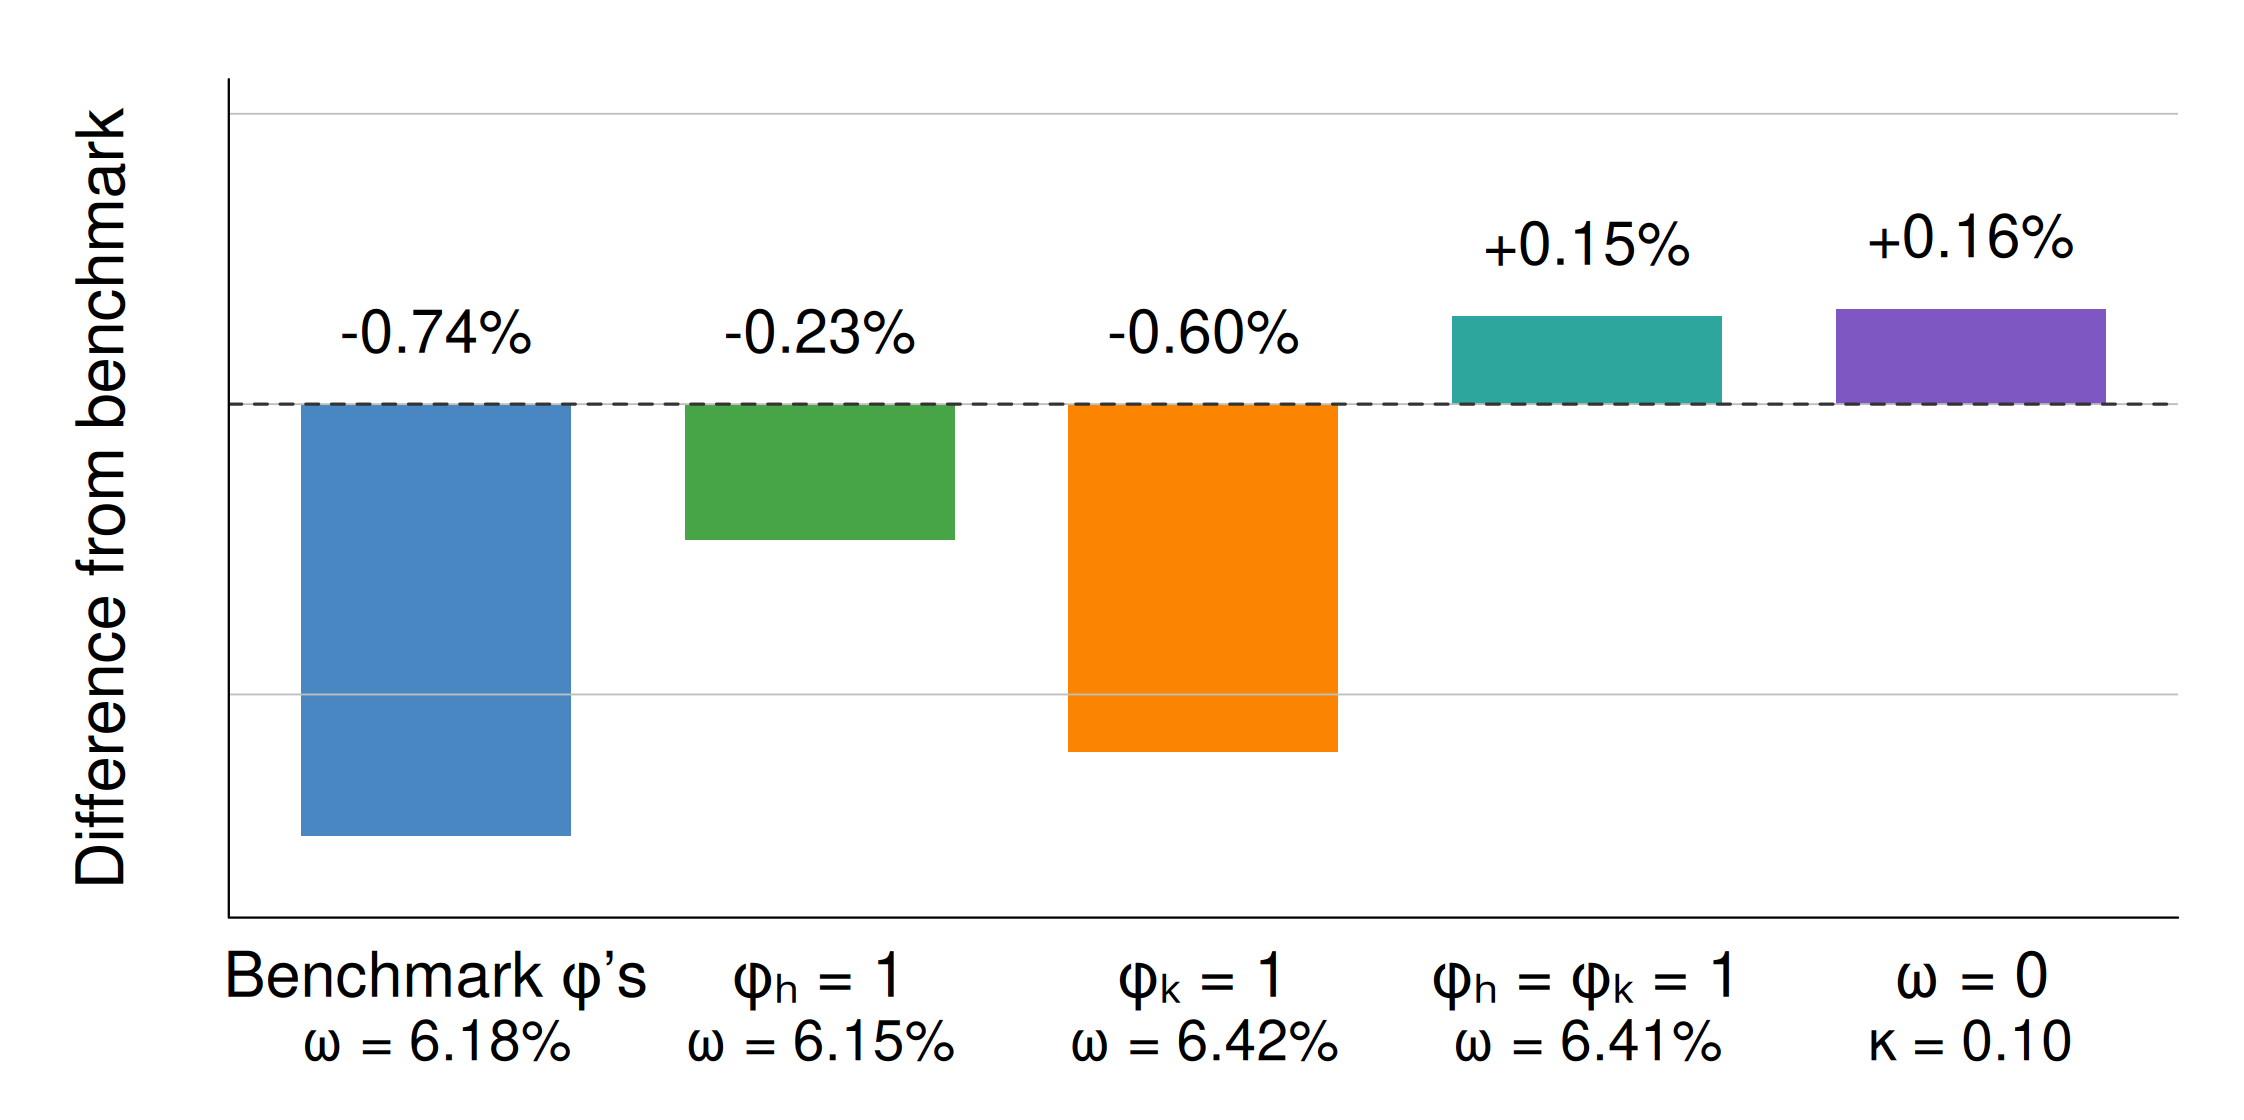
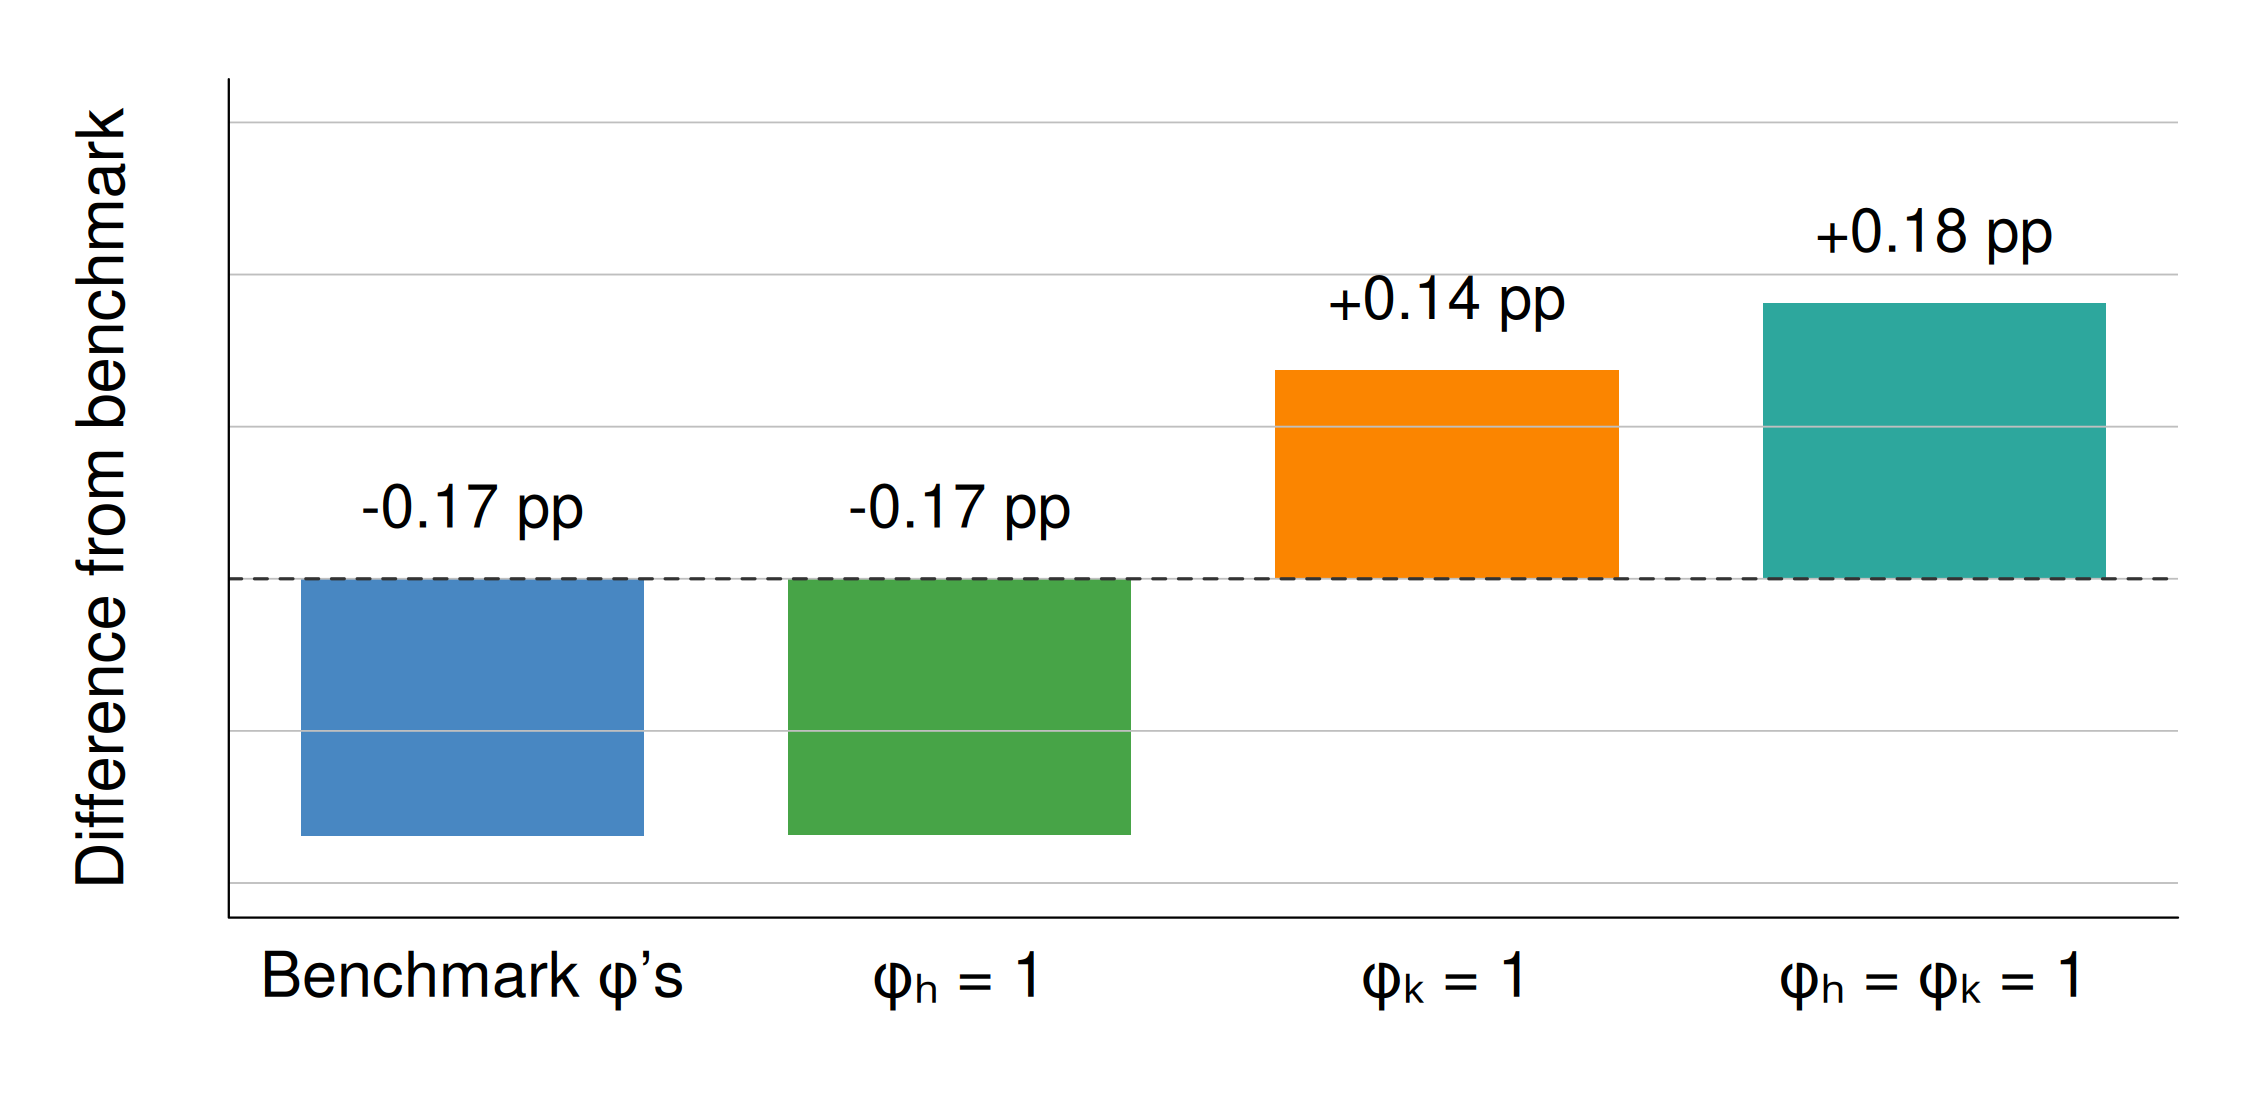
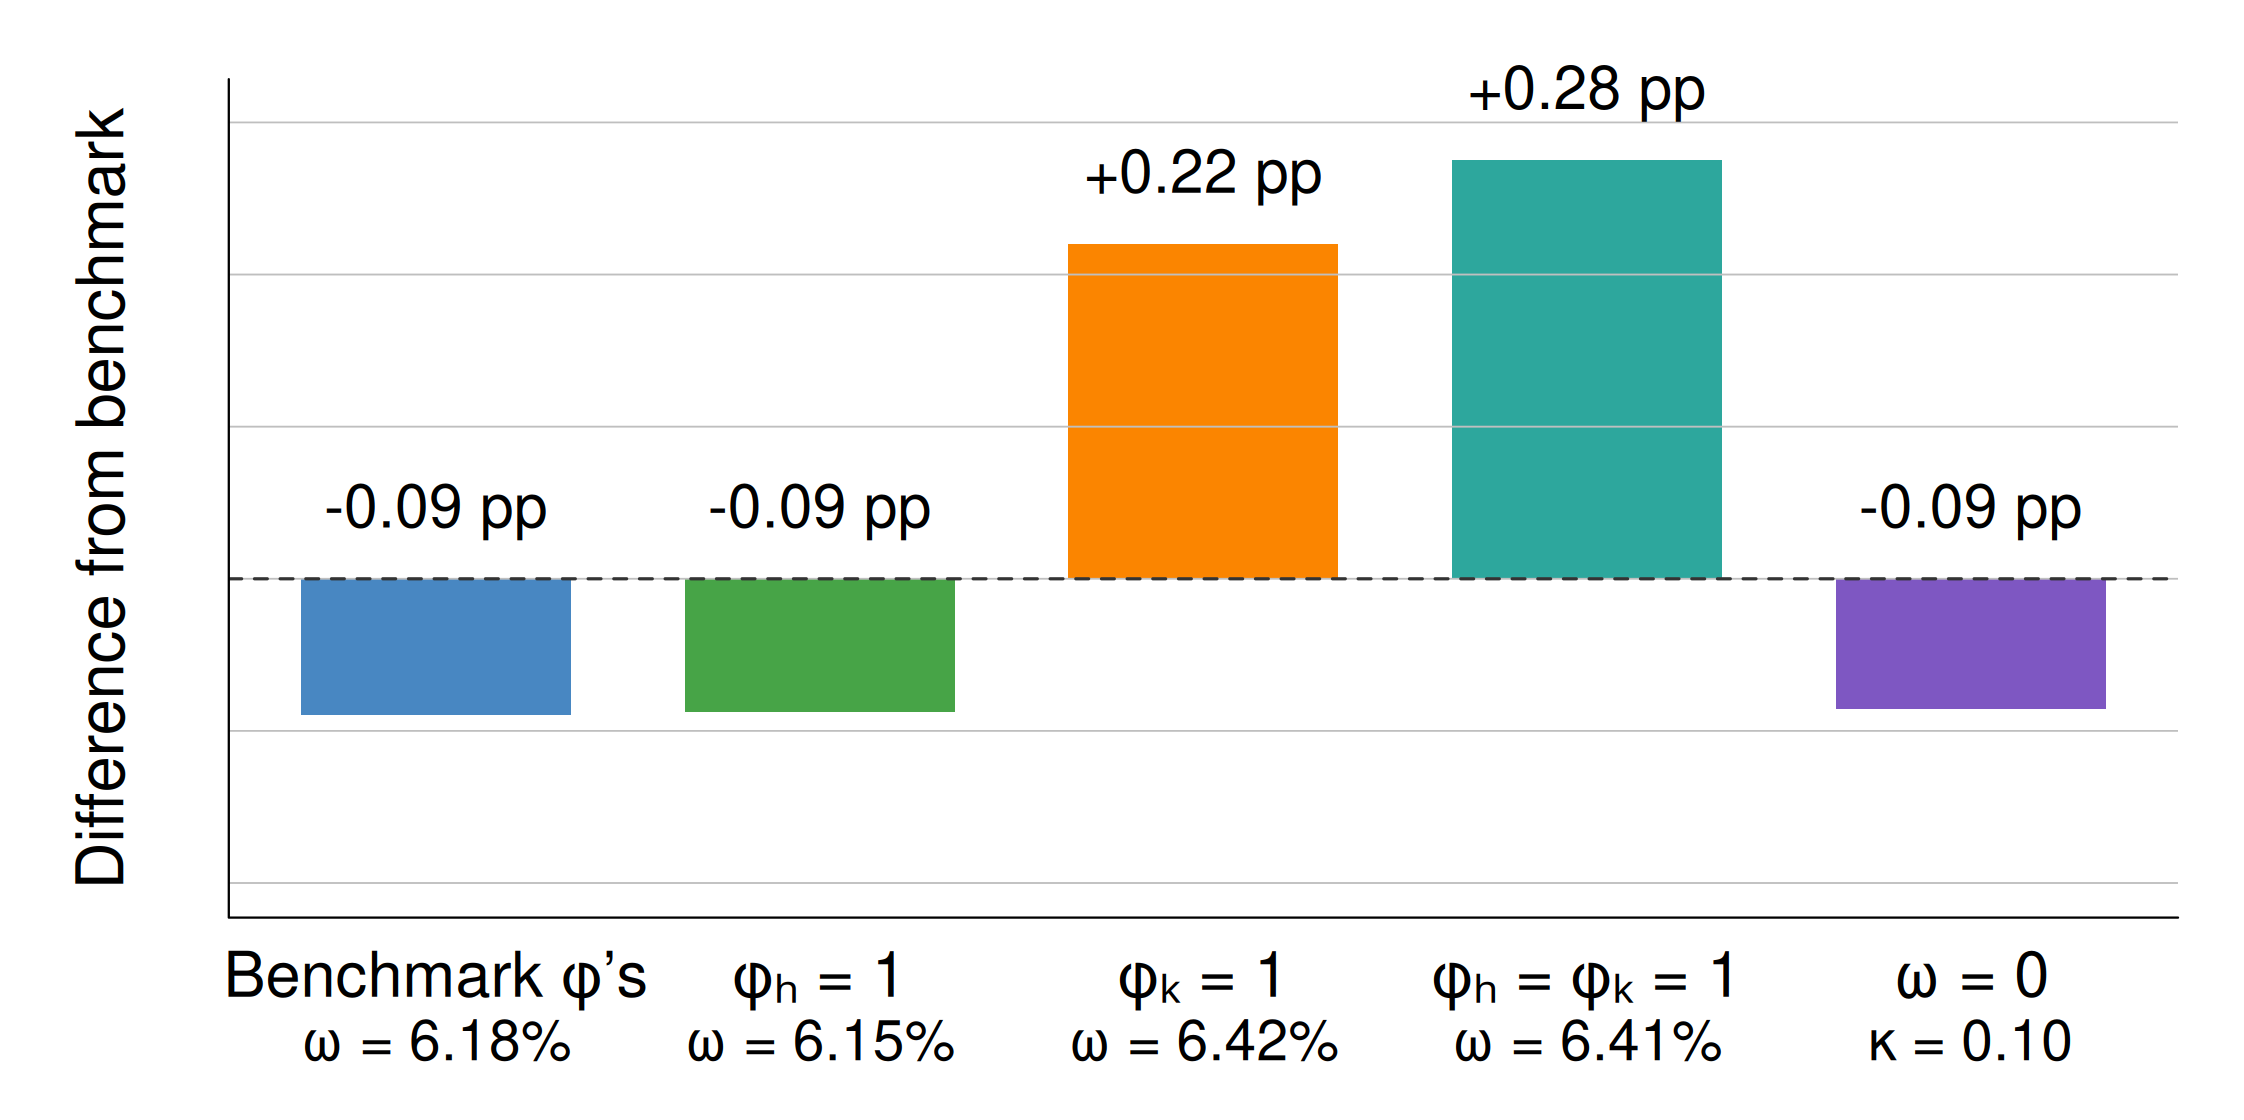
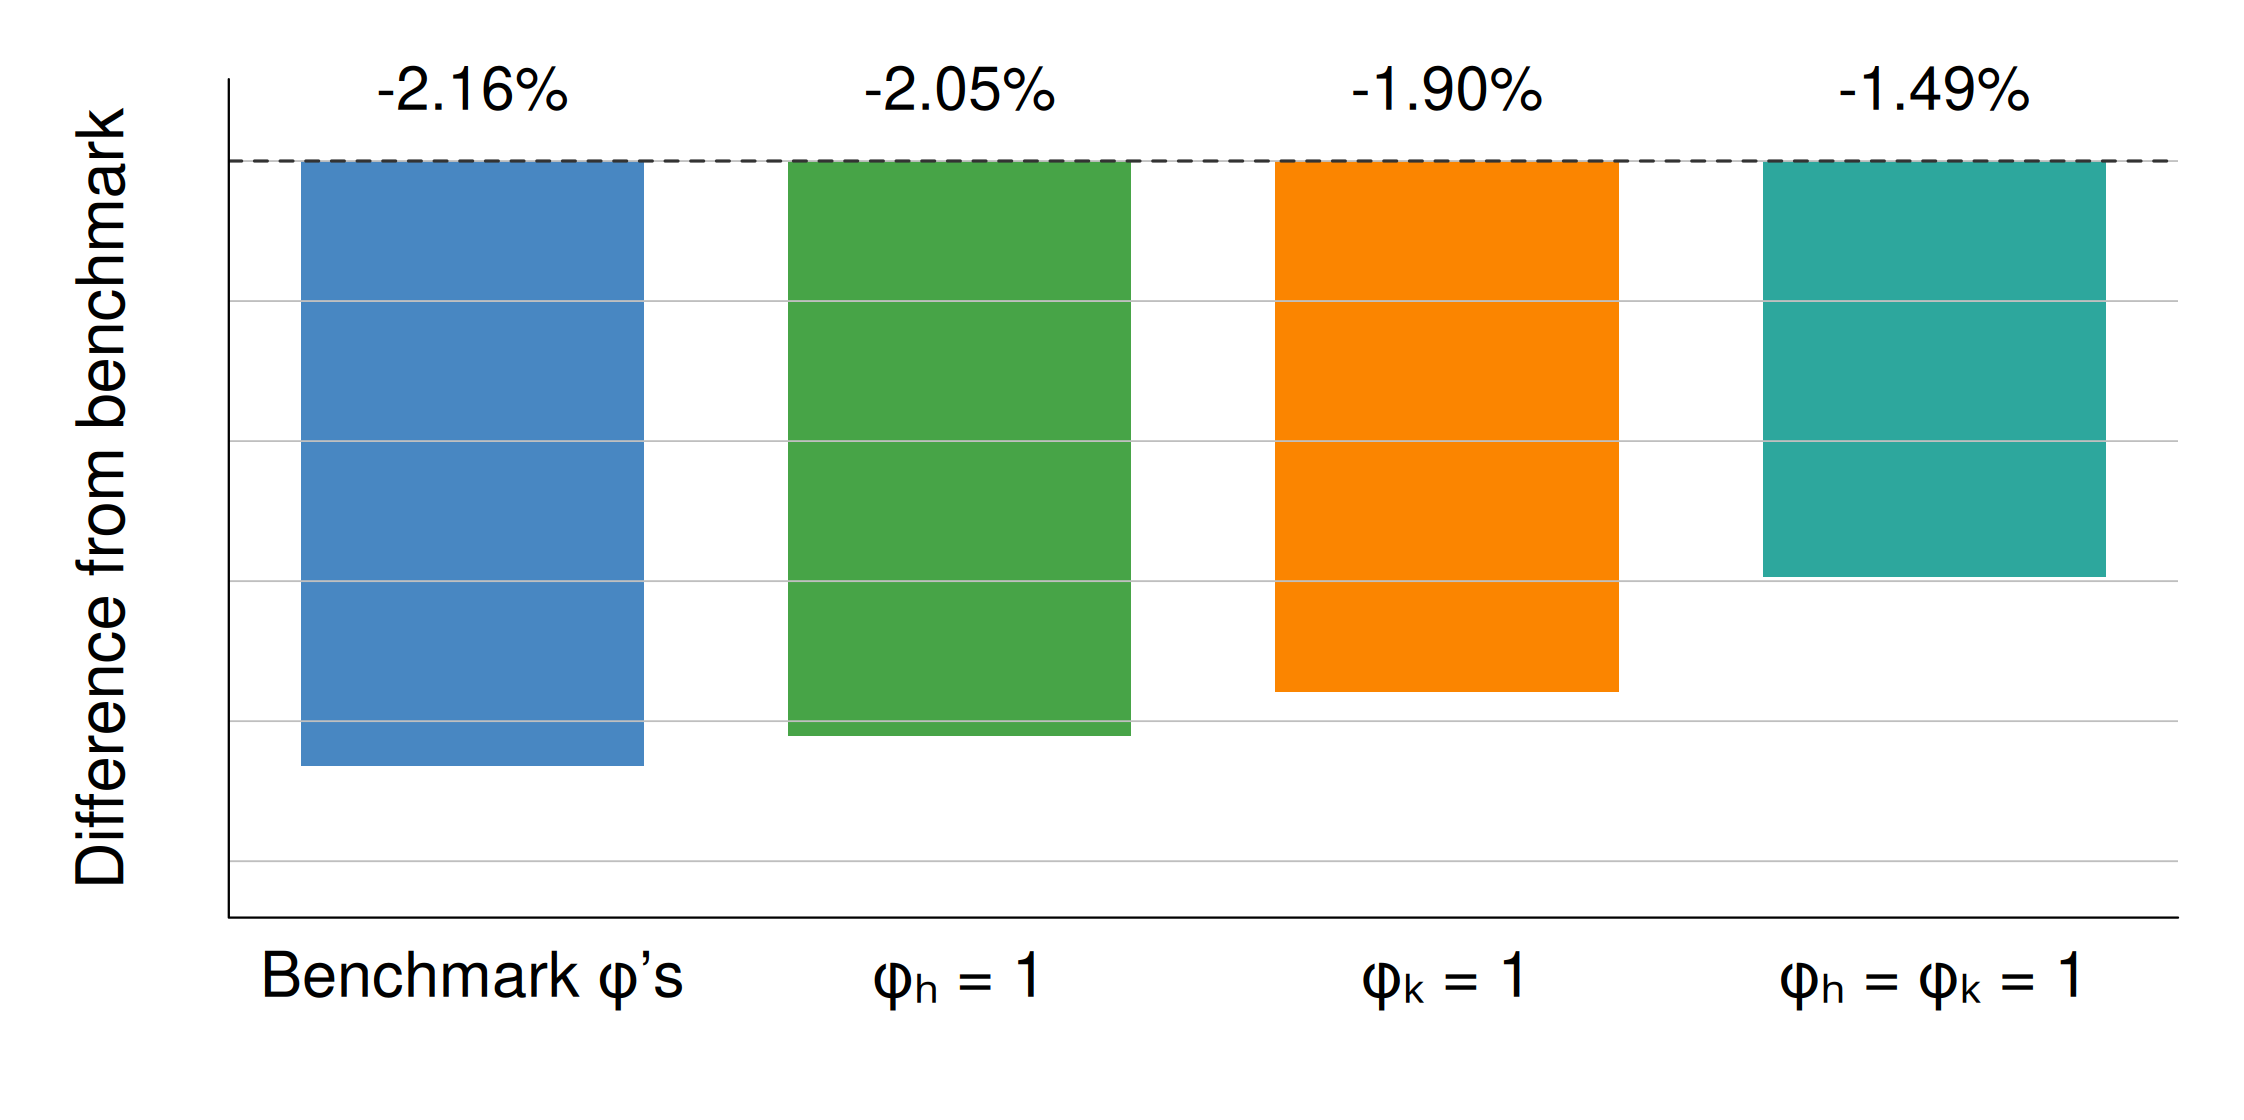
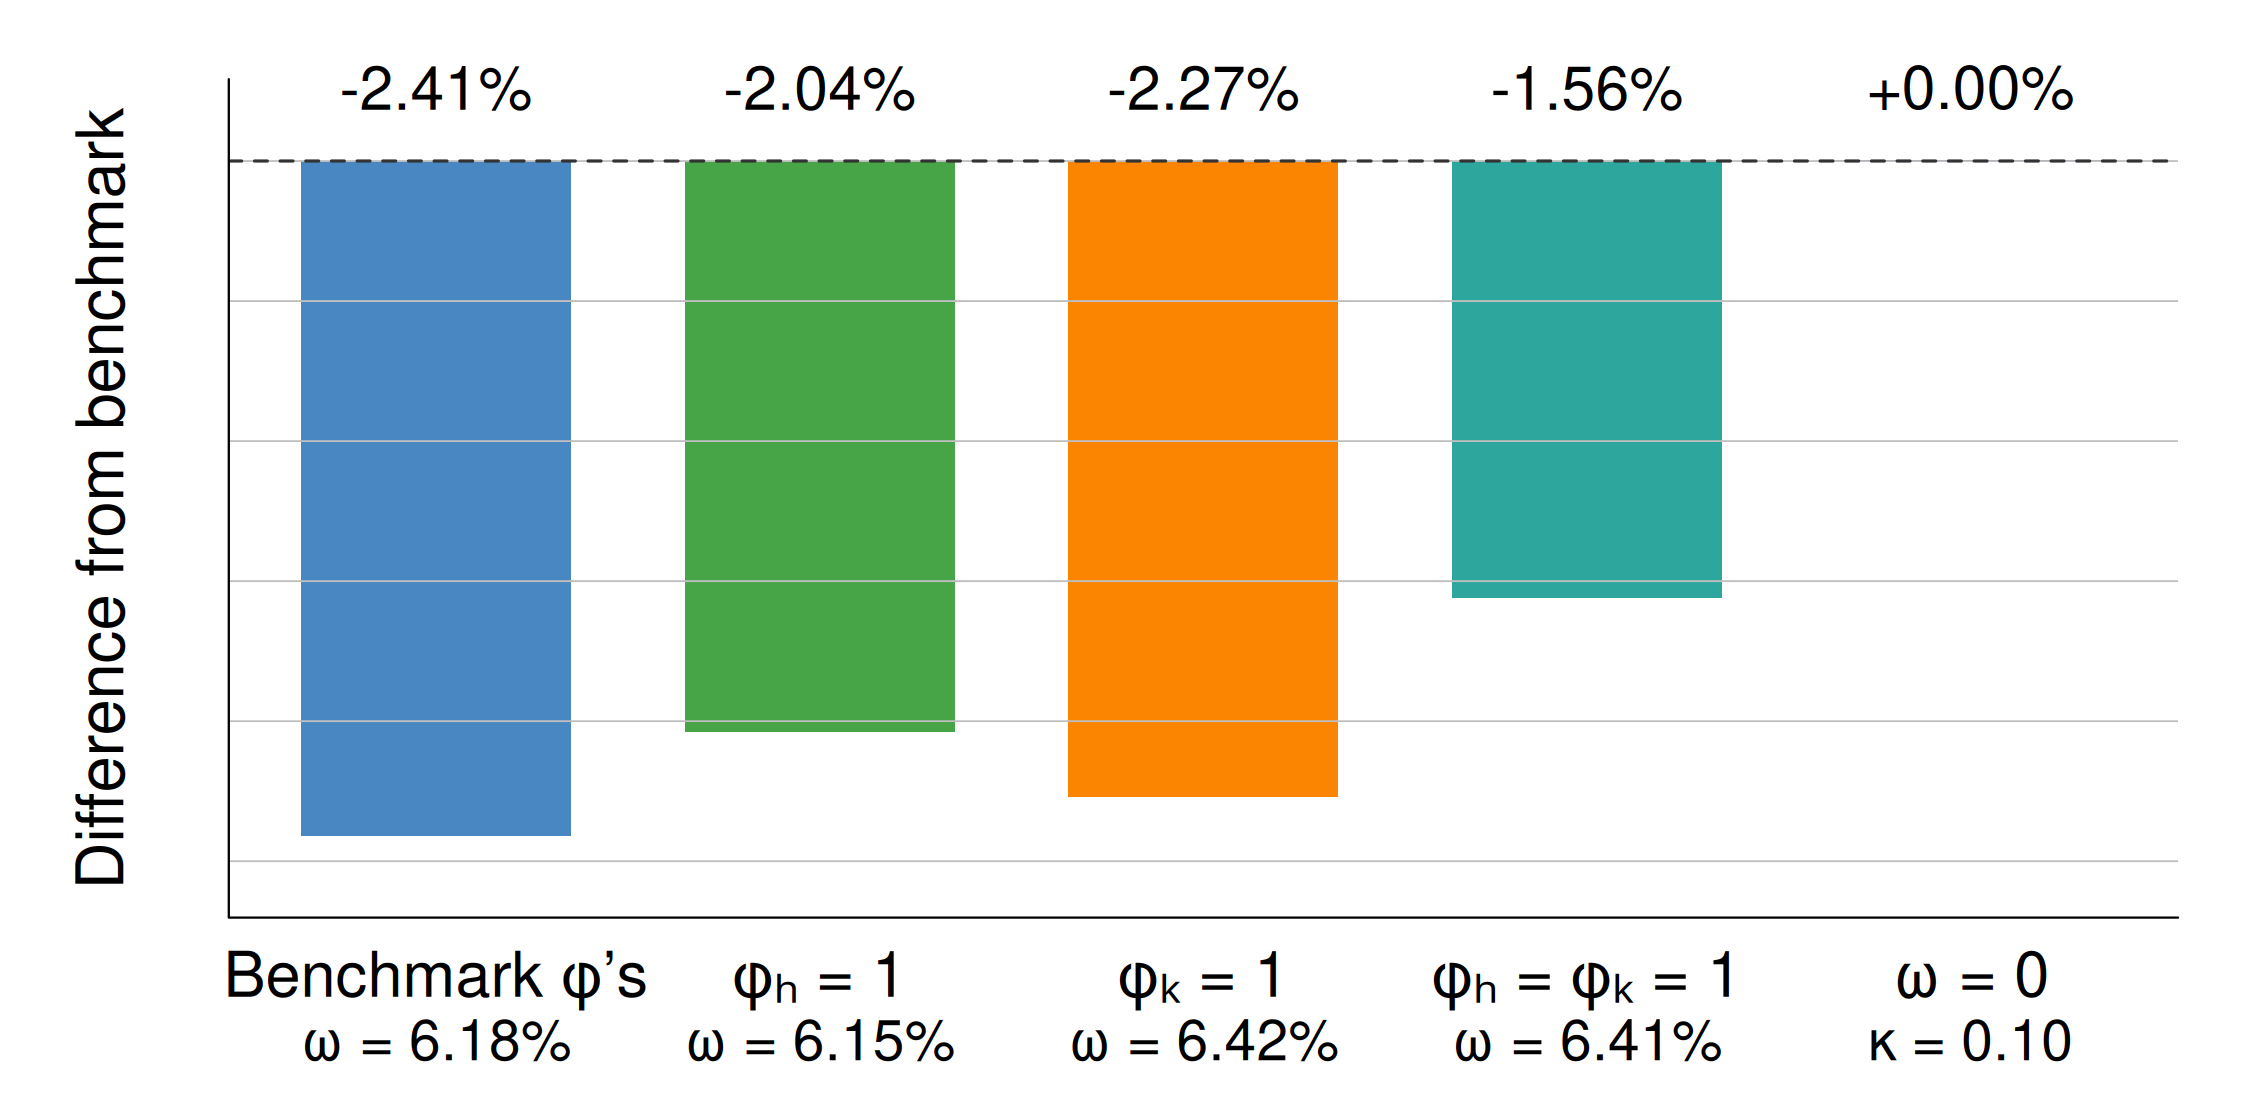
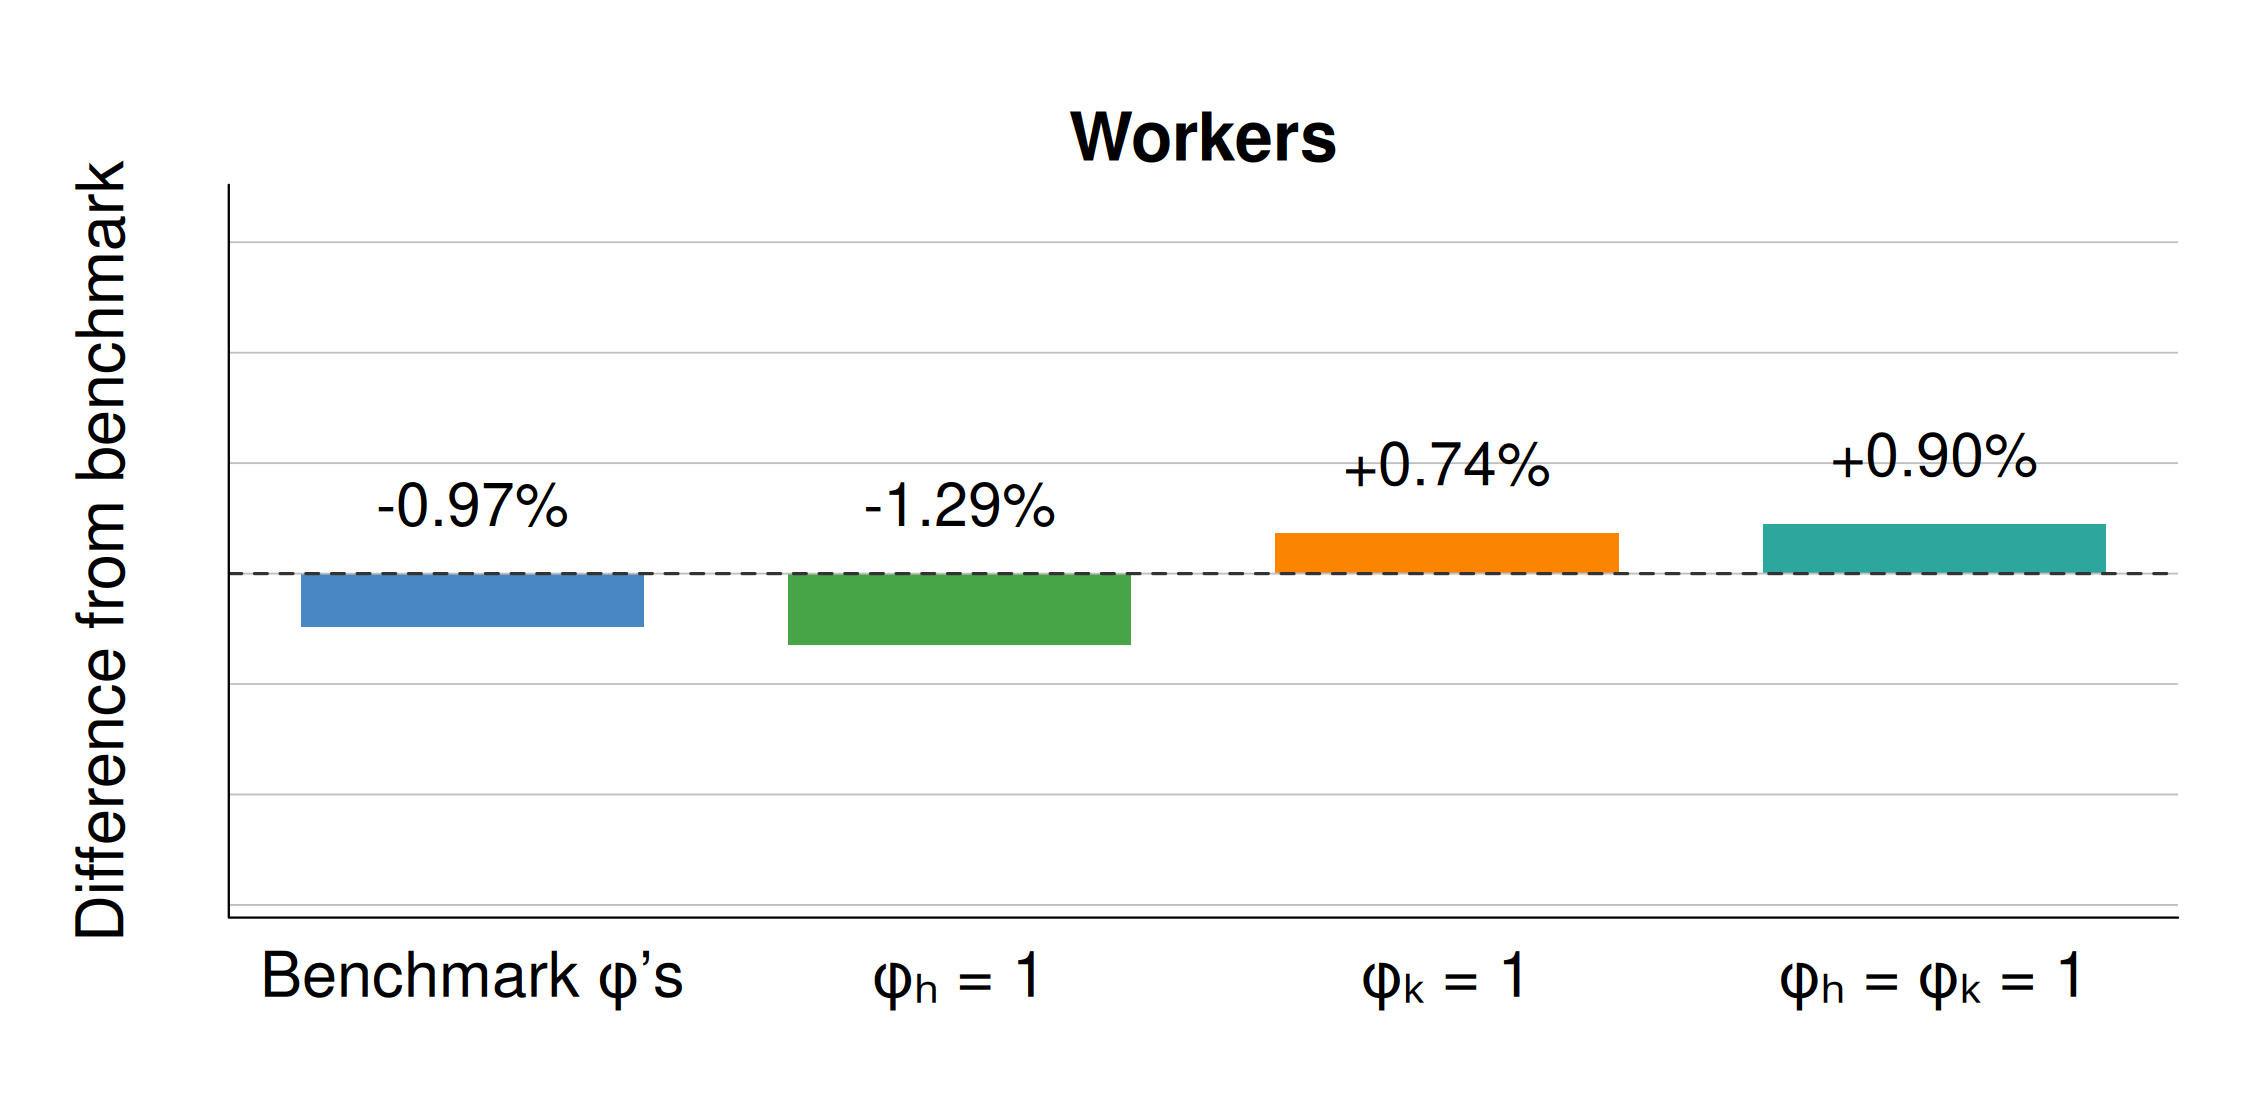
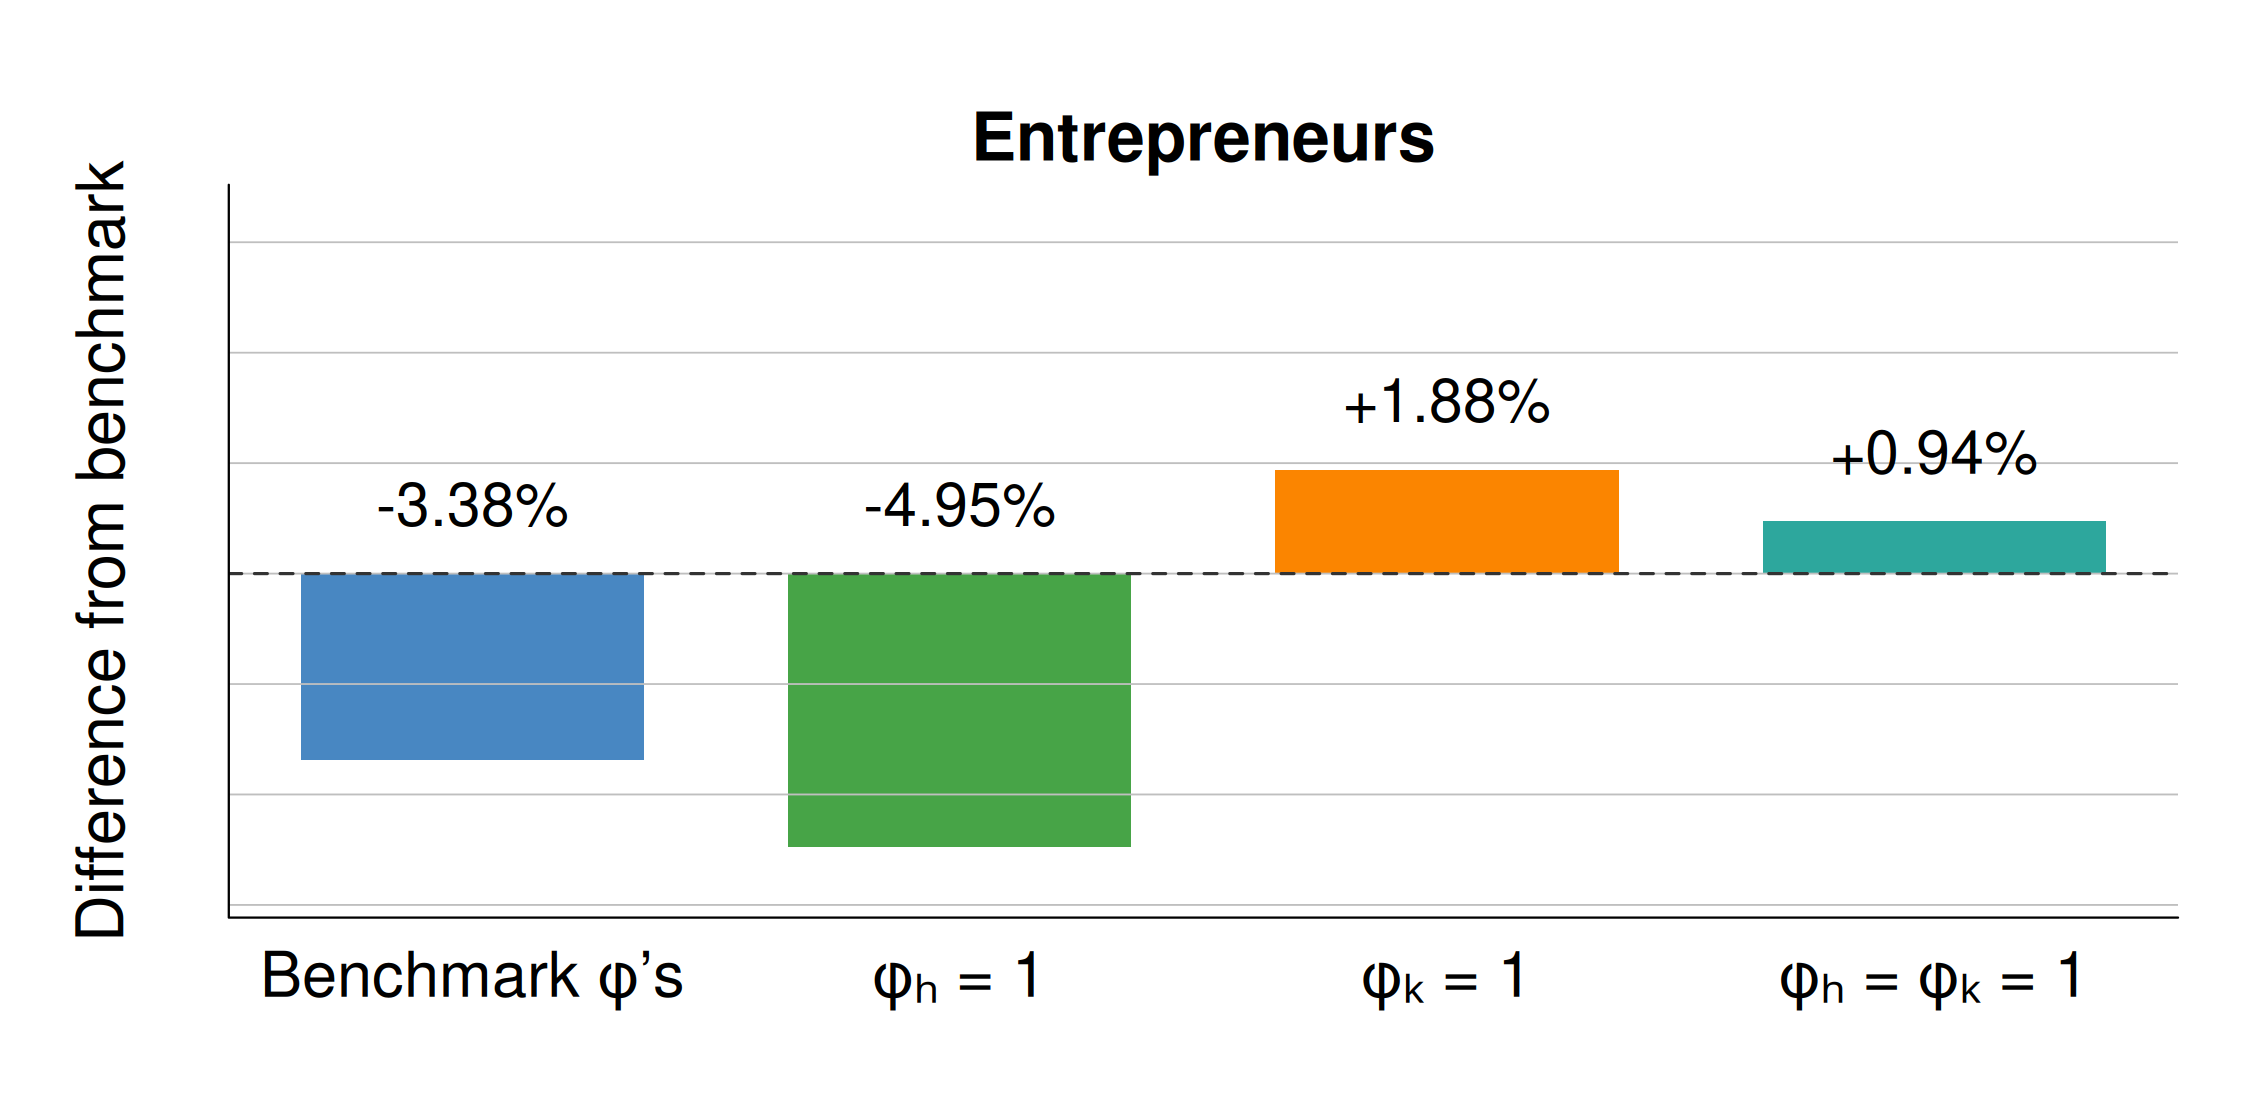
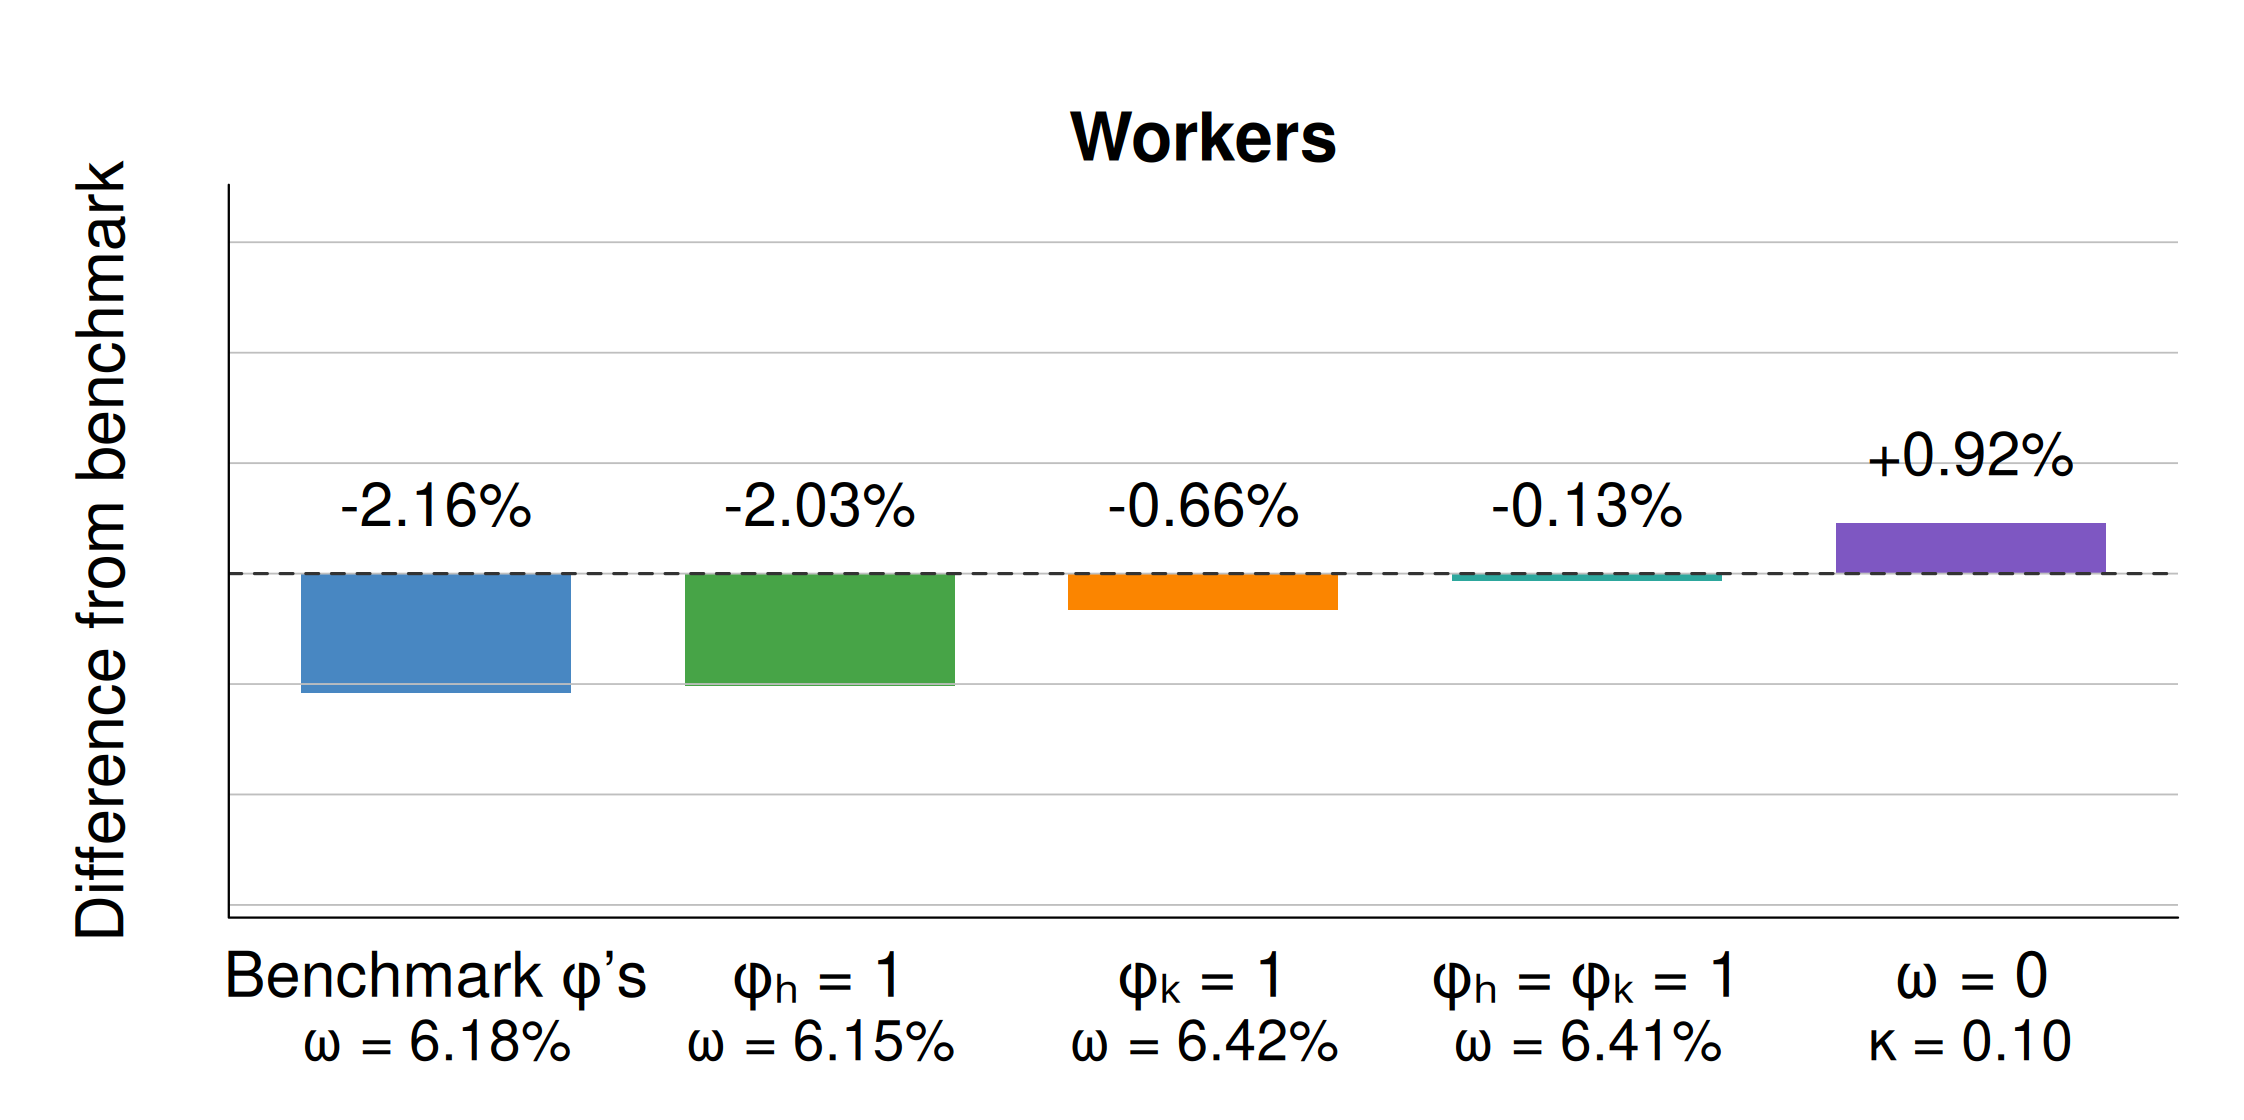
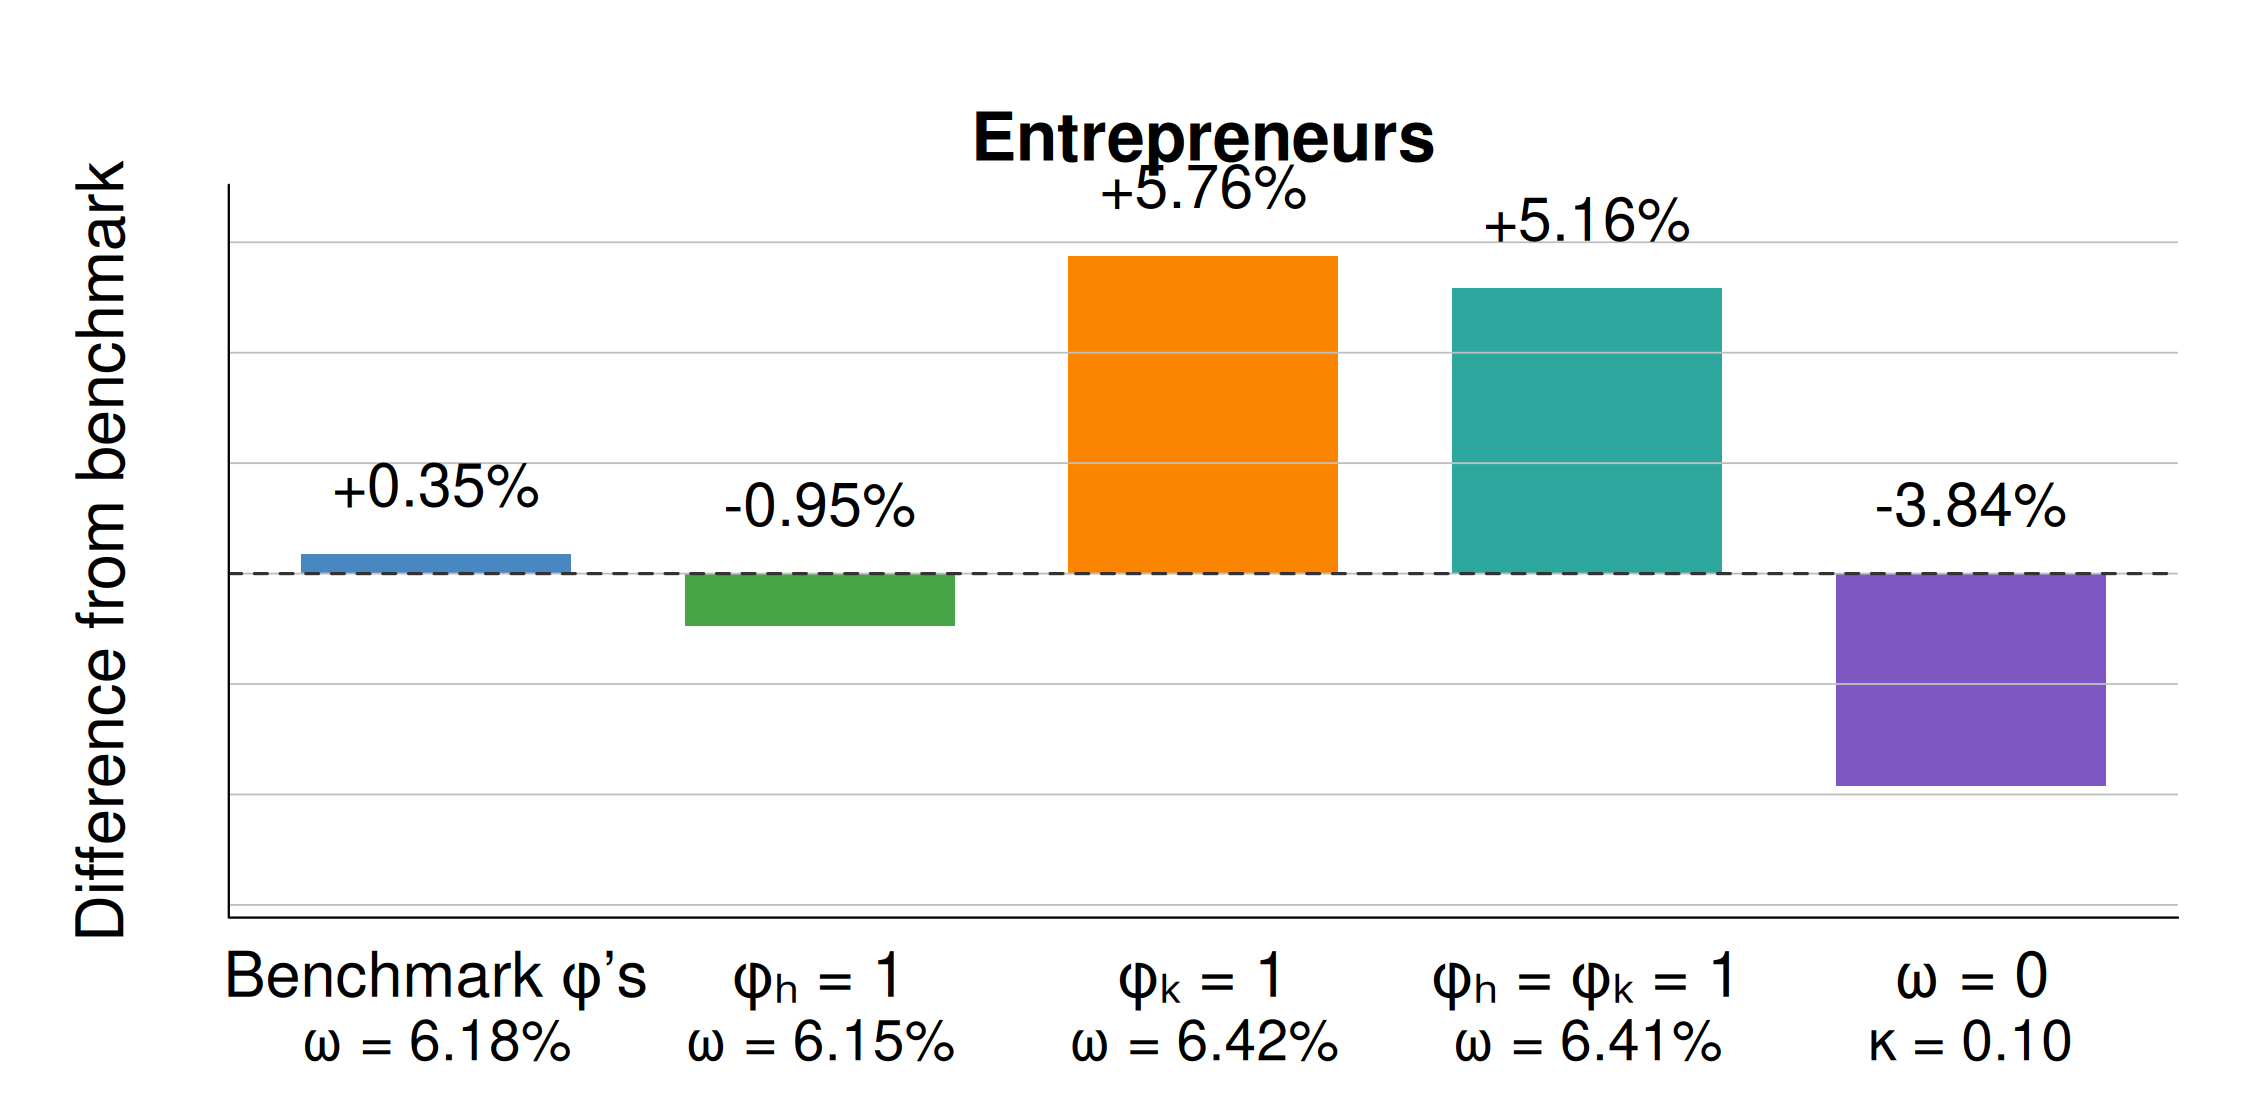
Quantitative question: can these mechanisms overturn UBI’s negative effects?
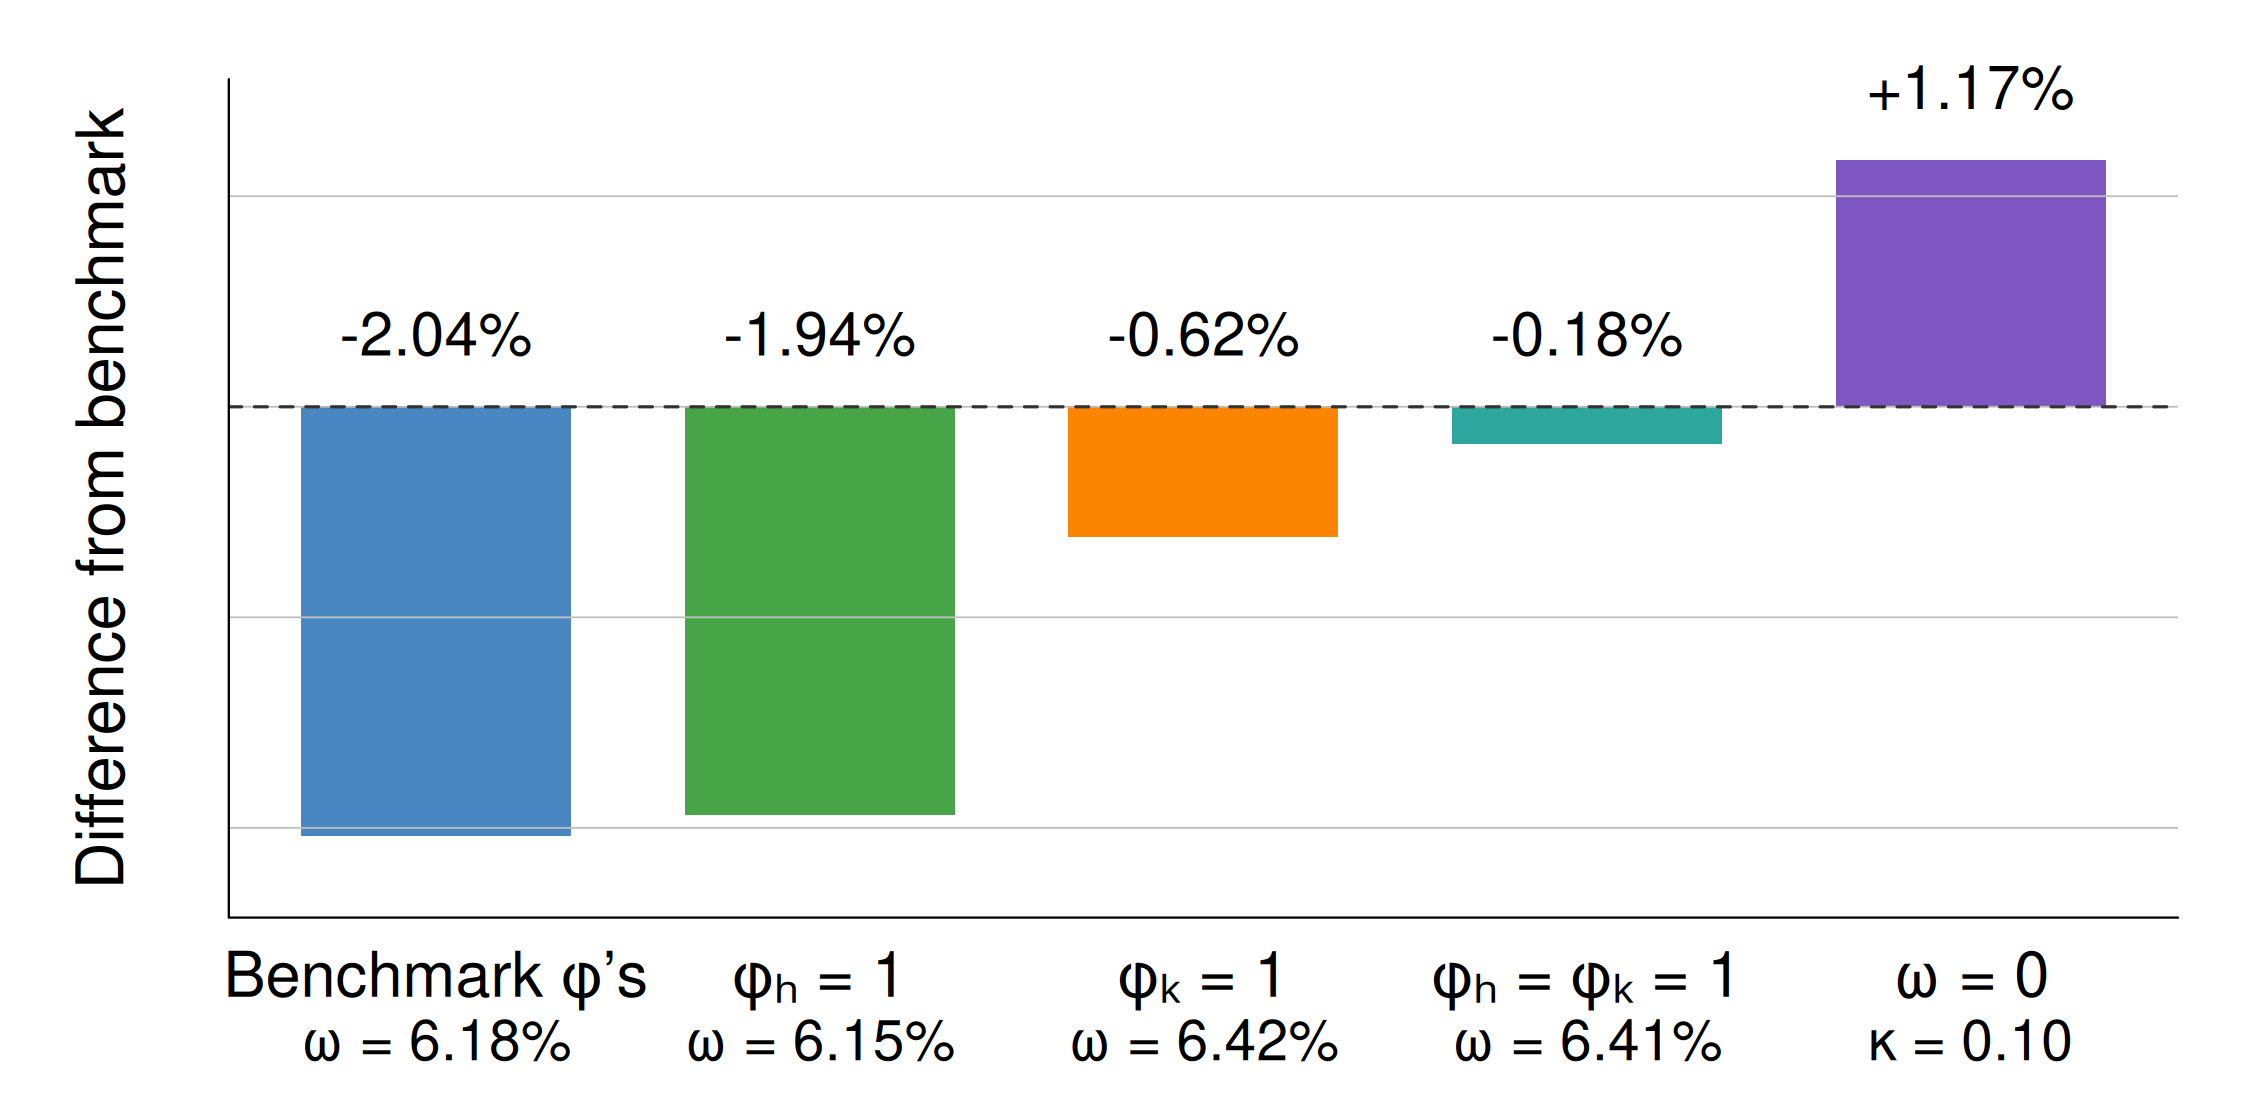
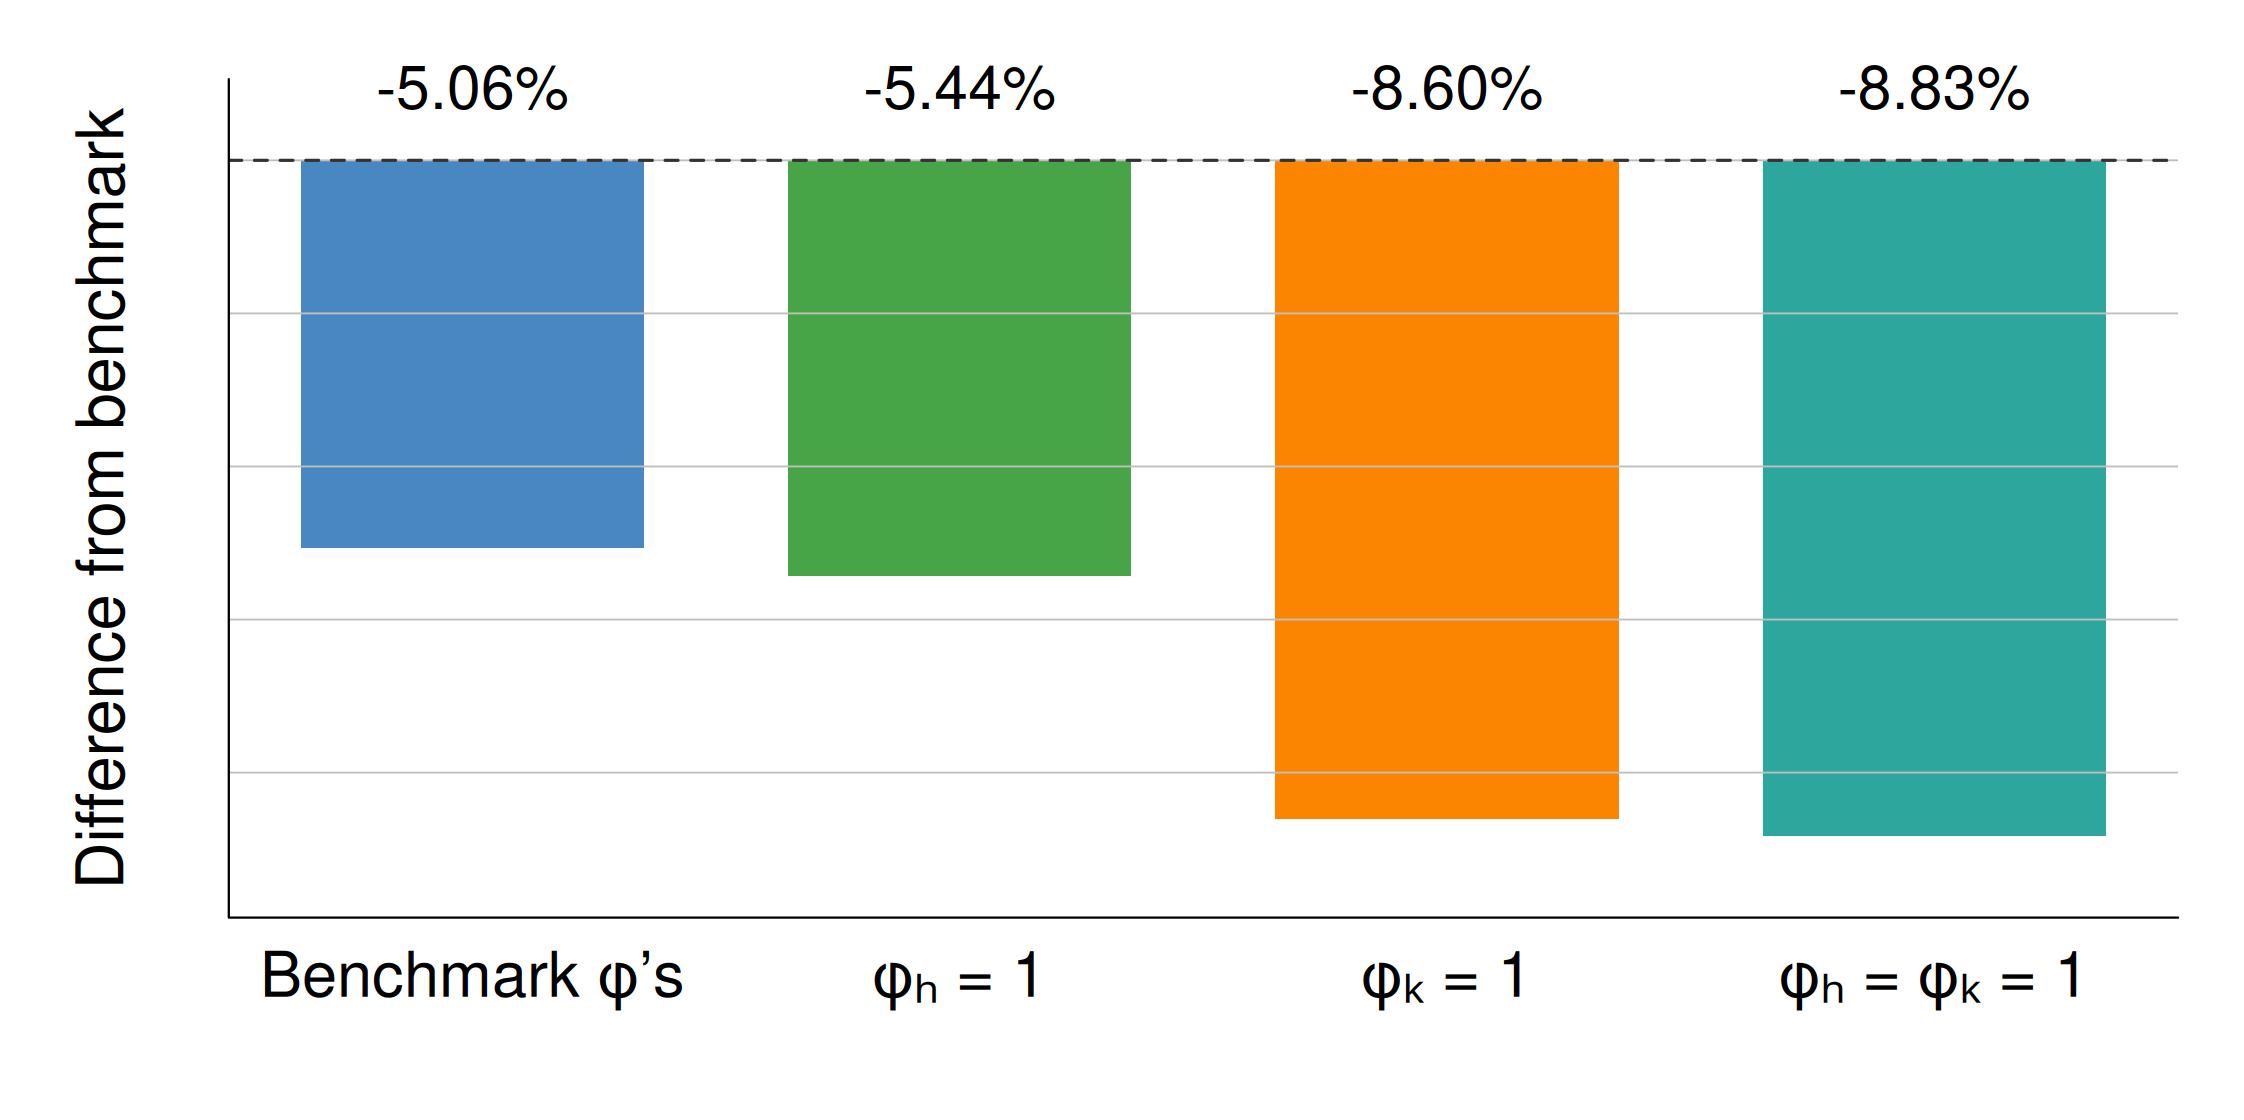
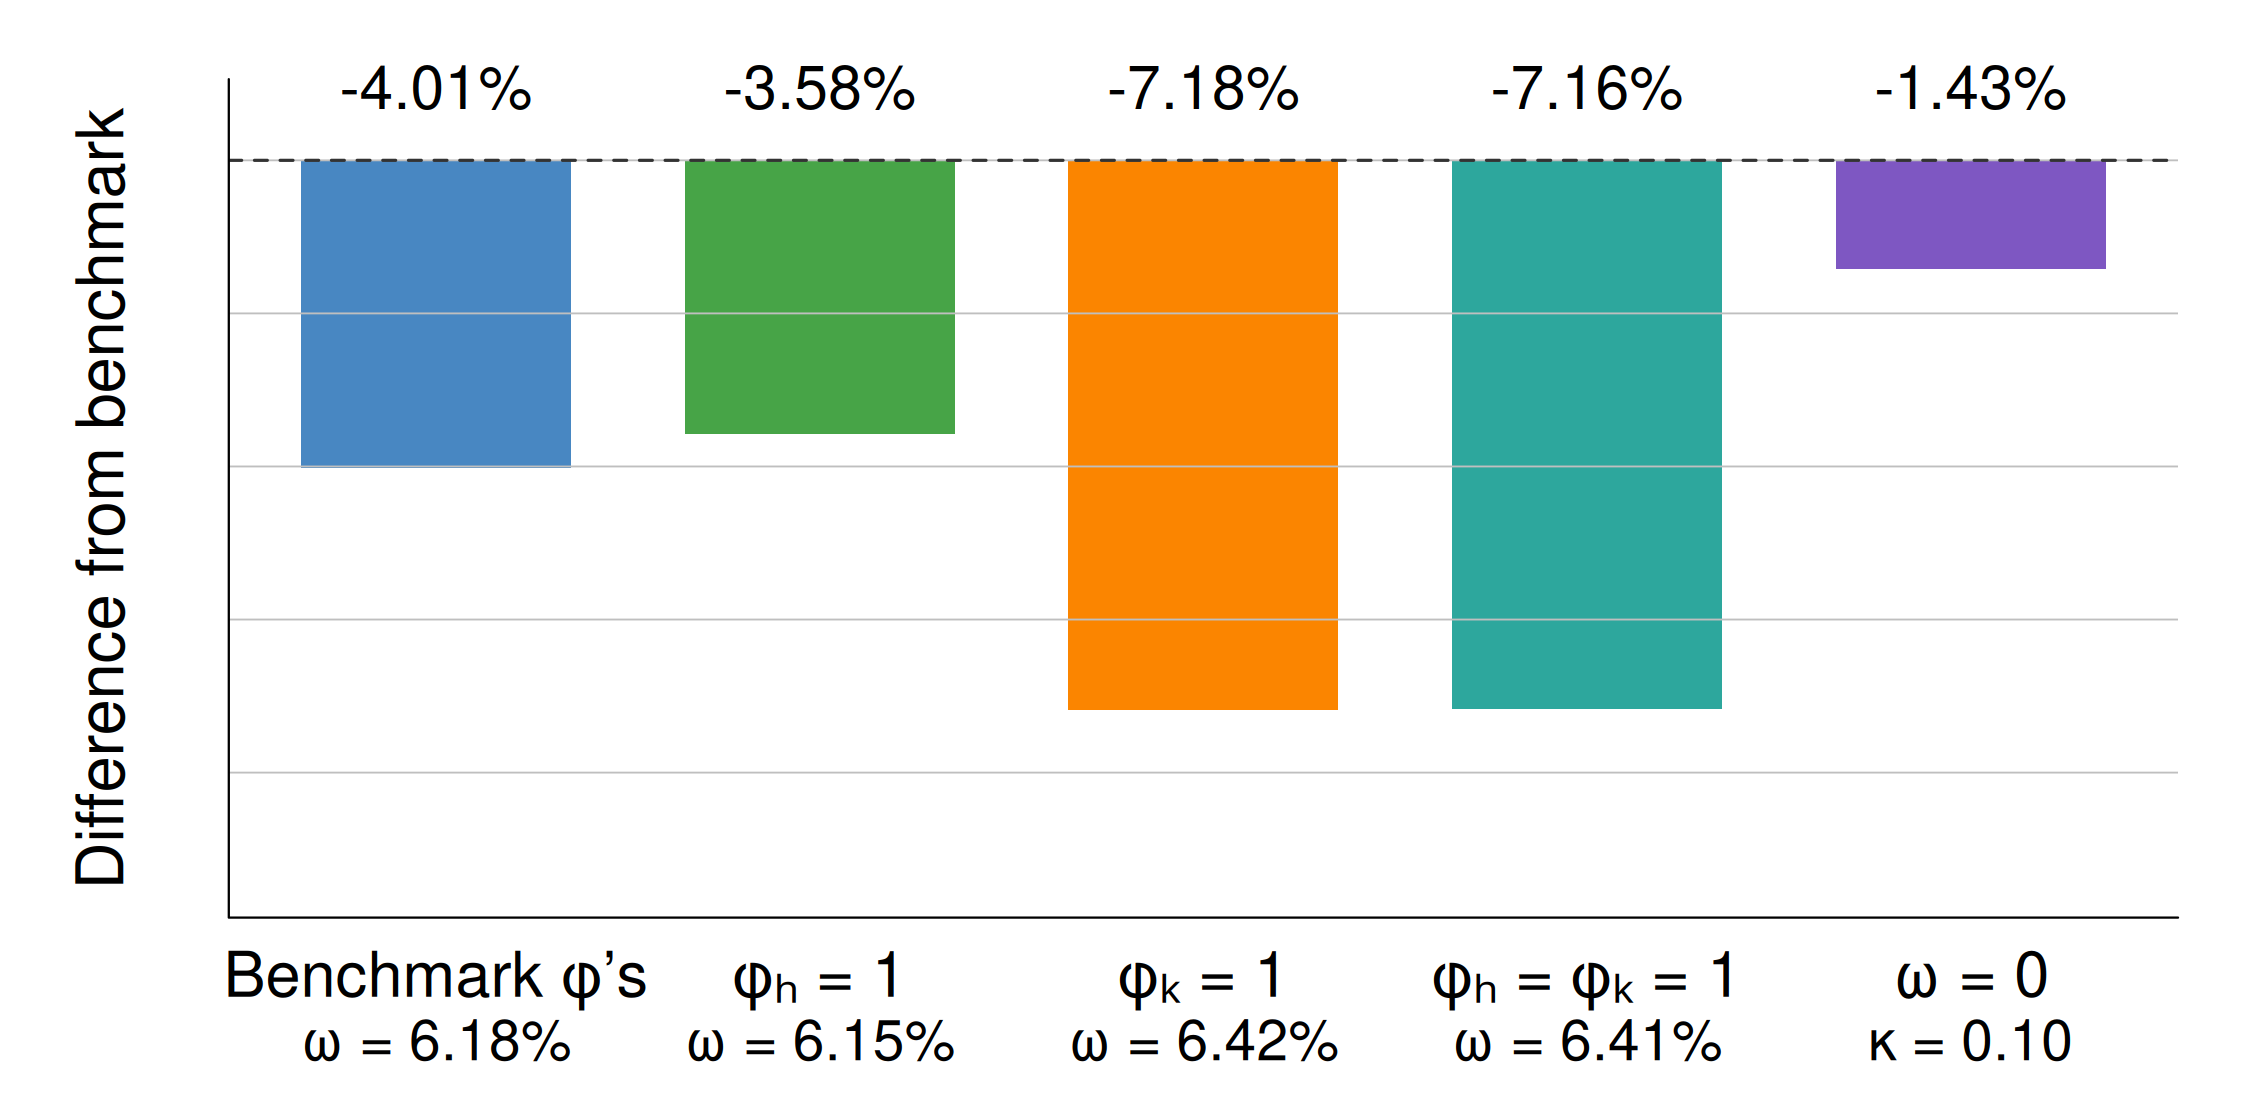
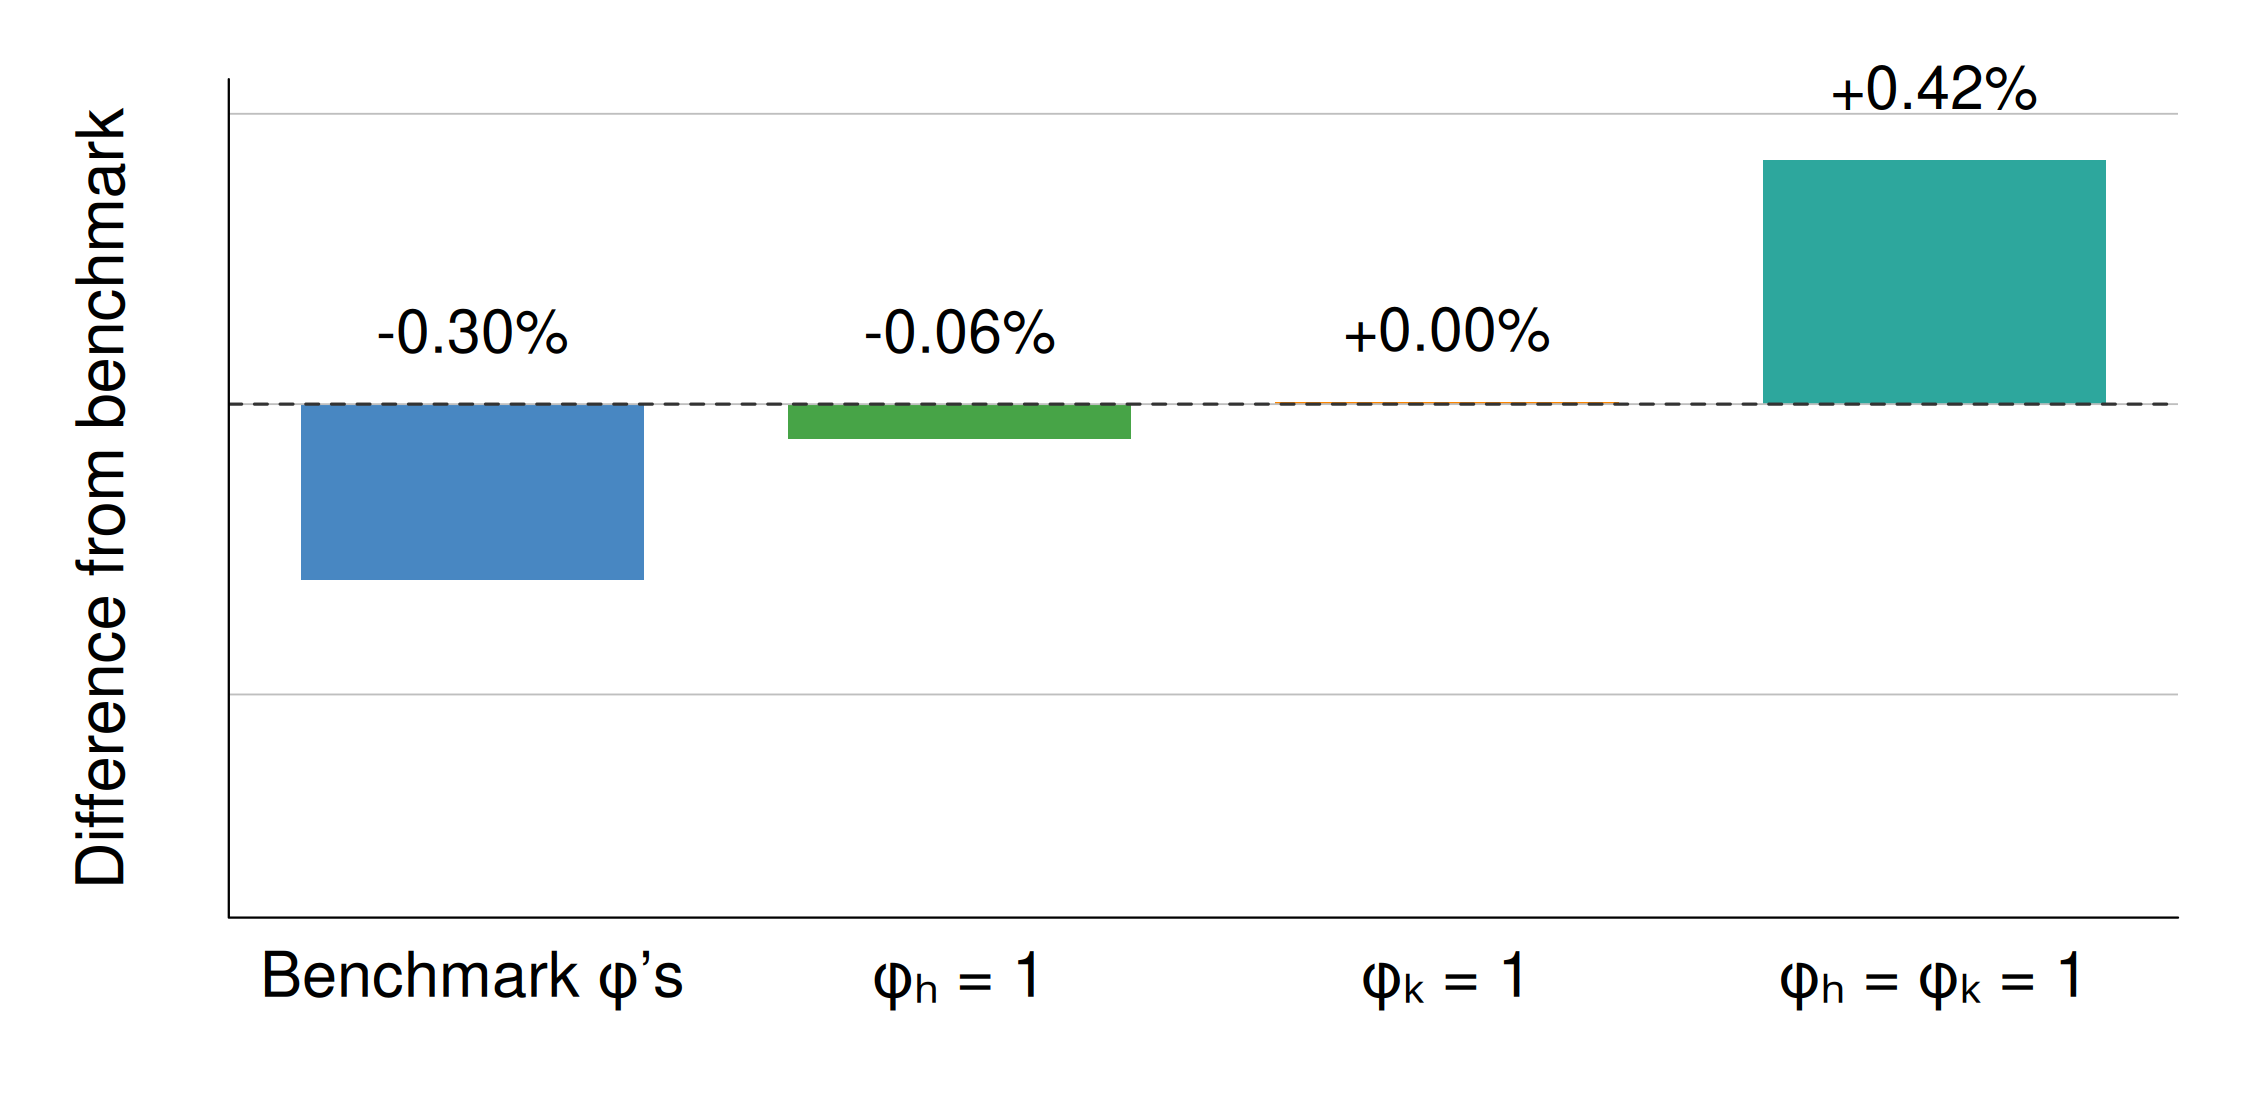
Let \(\Omega_s:=\) present value of future transfers at time \(s\), and define \[ a_{s+1}\ge-\frac{\color{red}{\phi_h}\Omega_{s+1}}{1+r}, \qquad k\le\lambda(a+\color{red}{\phi_k}\Omega_s). \]
Tradeoff: lowers private capital financing, leading to ambiguous GE effects
| Policy | Pledgeability? | SWF? |
|---|---|---|
| UBI |
No | No |
| UBC |
Yes | No |
| SWD |
No | Yes |
| SWC |
Yes | Yes |
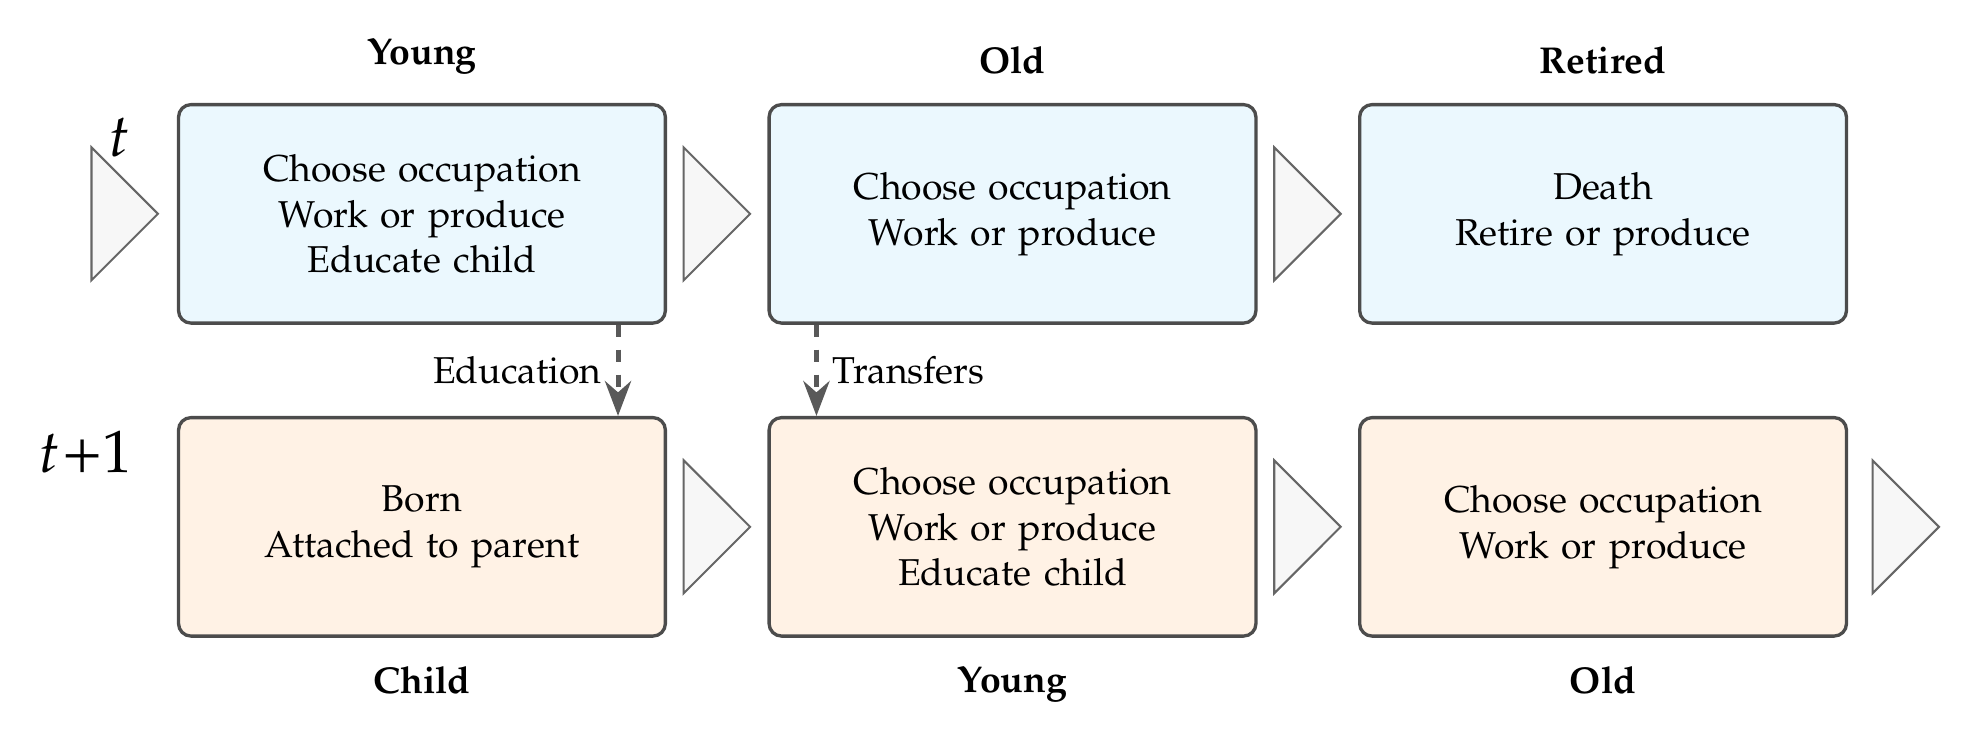
\[ V(a,h,z)=\max\{V^W(a,h,z),\mathbb EV^E(a,h,\epsilon z)\}, \] - Child investment \(e\): \[ h'\sim H(\cdot\mid h,e),\qquad z'\sim F(\cdot\mid h'). \]
Proposition (UBI\(\prec\)UBC) \[ \begin{aligned} V^{UBC}(a,h,z) &\ge V^{UBI}(a,h,z) \\ e^{UBC}(a,h,\tilde z) &\ge e^{UBI}(a,h,\tilde z) \end{aligned} \] with strict gains when early constraints bind on a non-degenerate set.
Corollary (UBI\(\prec\)UBC and bequests) The welfare gap \[ \mathbb{E}\left[ V^{UBC}(a',h',z')-V^{UBI}(a',h',z')\right] \] is larger whenever the bequest constraint binds.

Lemma:
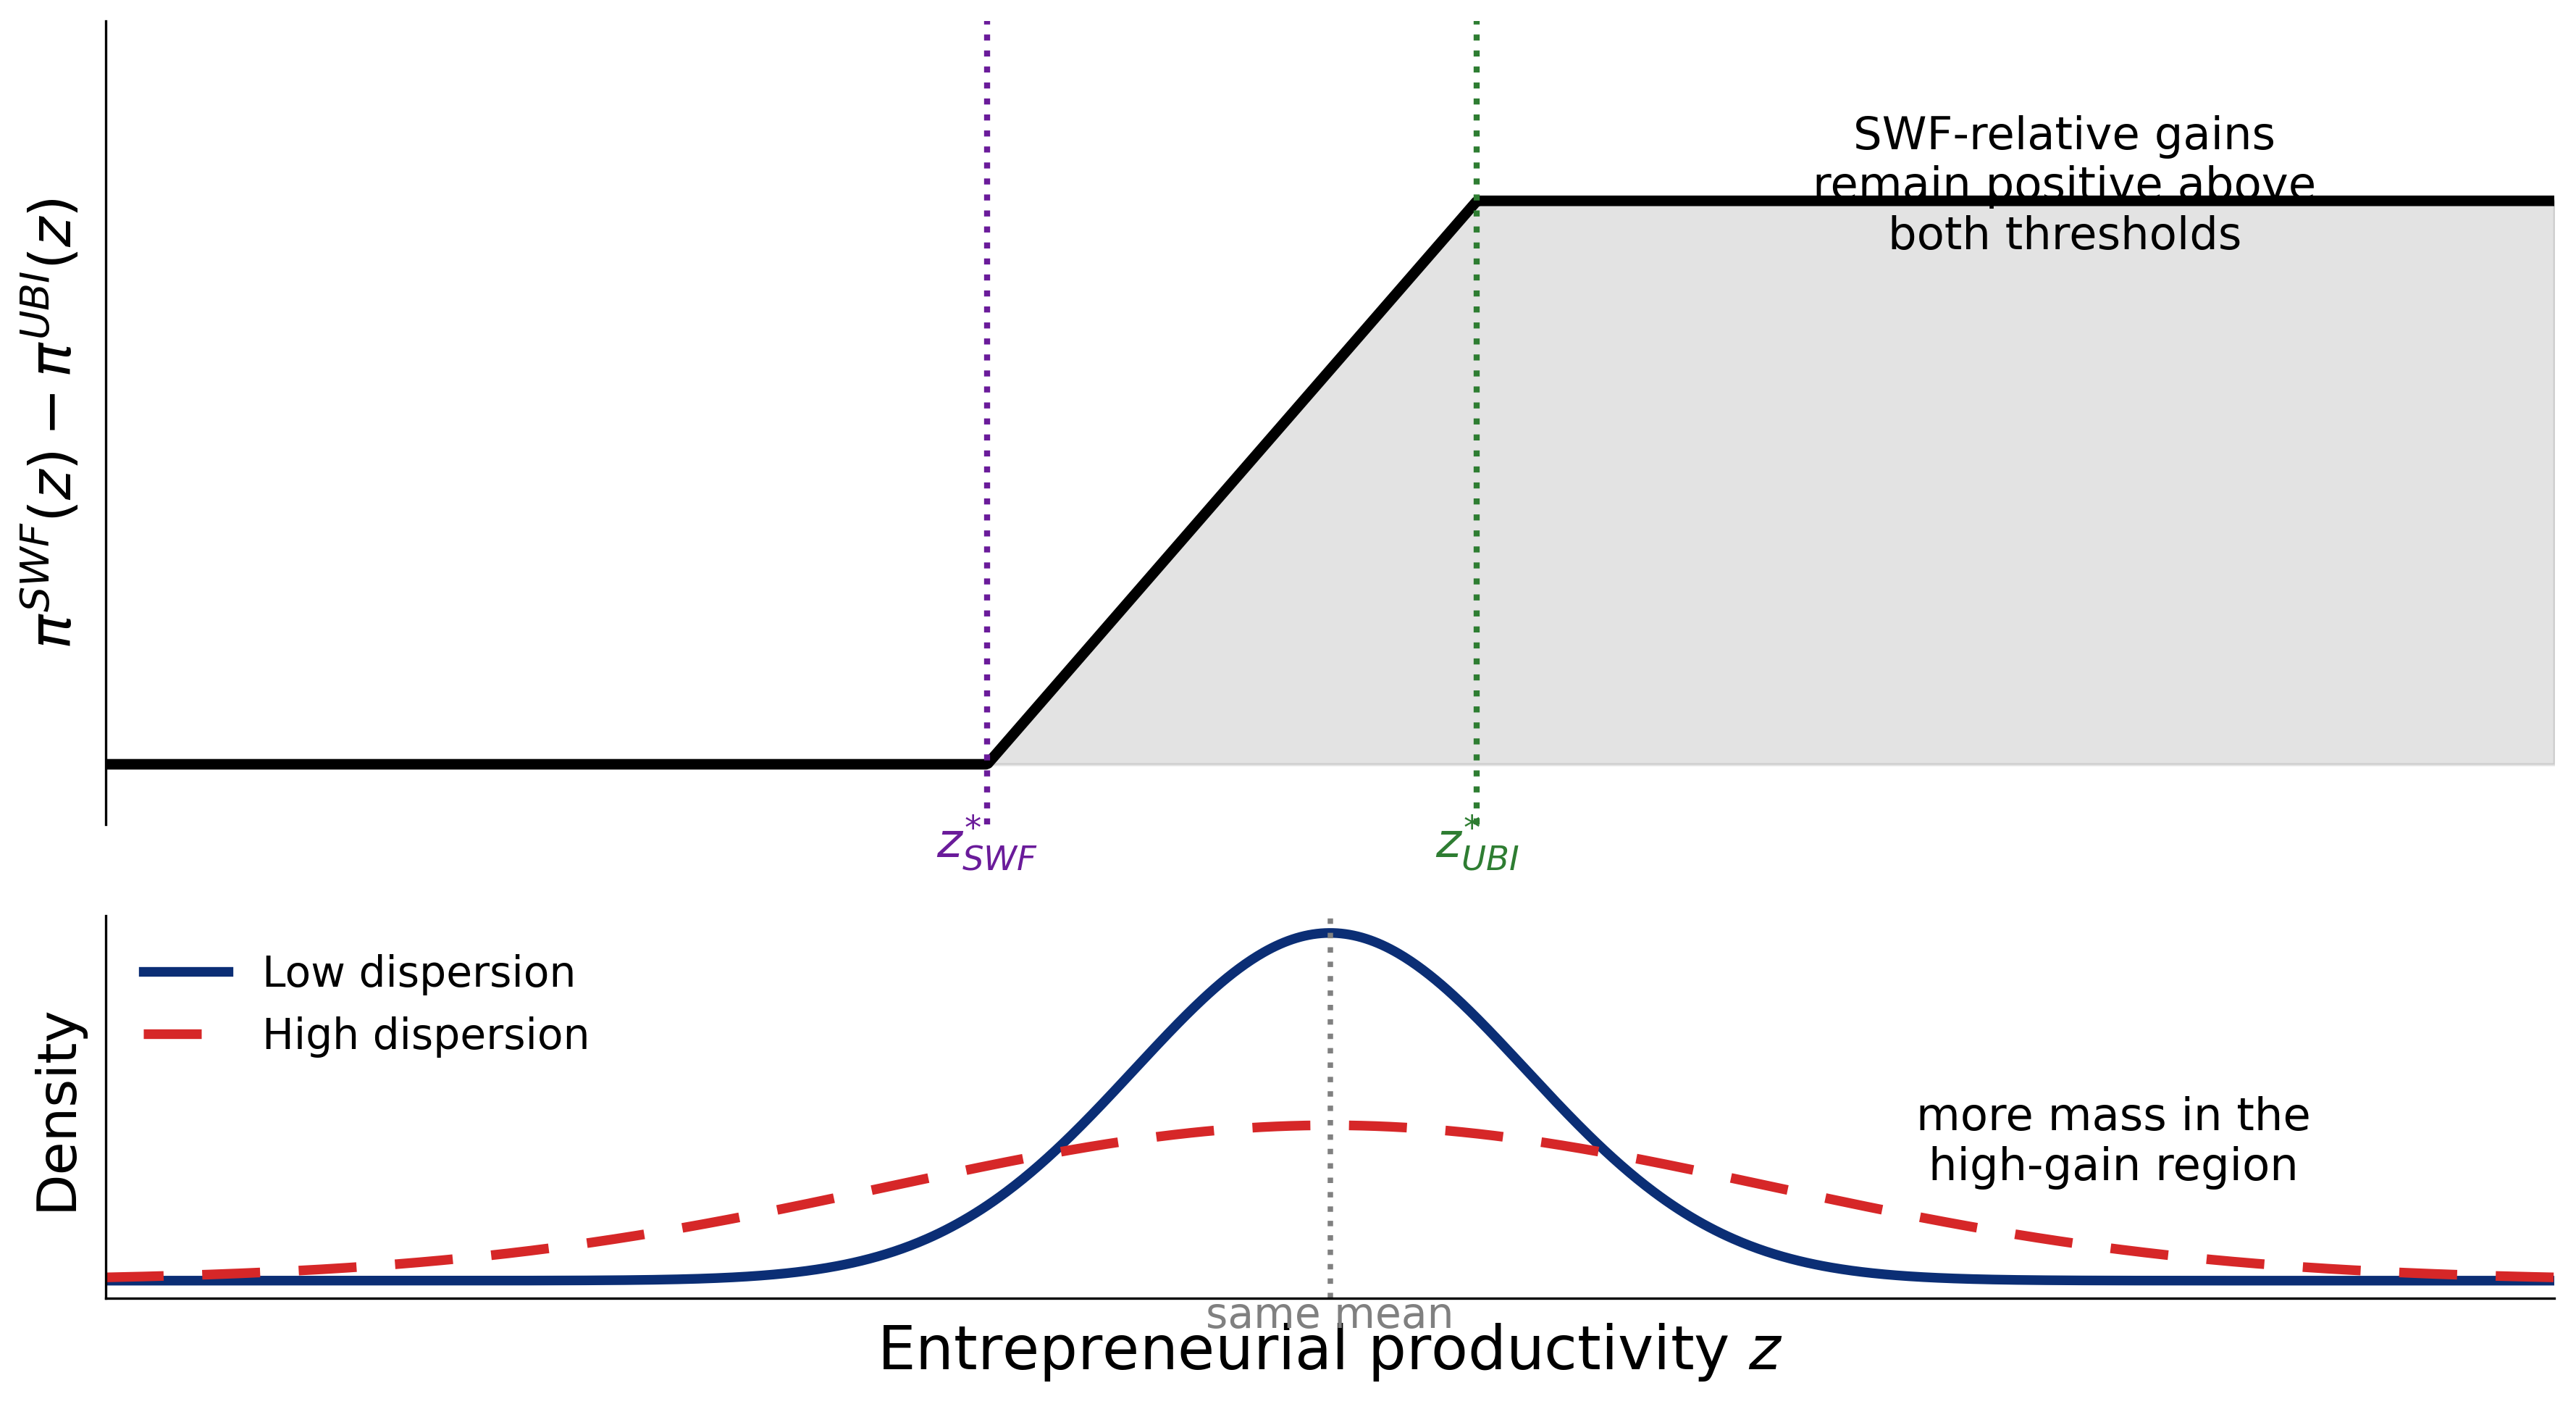
If \(r>0\), SWF net proceeds imply: \(\omega^S>\omega^U\) since \(k(a,\epsilon z)=0\) if \(R(\epsilon z;w)\leq\bar R\).
Proposition (UBI\(\prec\)SWD) \[ V^{SWD}(a,h,z)>V^{UBI}(a,h,z) \] since larger \(\omega^S\) frees resources.
As in UBI\(\prec\)UBC, welfare gaps are larger if the bequest constraint binds.


Exact calibration in progress
Limitations: no CEV welfare or transitions yet


Next: CEV welfare, incidence by wealth and earnings, transitions, optimal policy
\[ V^o(a,h,\tilde z_o)=\max_{c,e,a'\ge0} \left\{u(c)+\beta\mathbb E[V(a',h',z')\mid h,e]\right\}, \] subject to \[ e\le y_o+(1+r)a-\tau(a,h,\tilde z)+\phi\omega, \] \[ c+e+a'\le y_o+(1+r)a-\tau(a,h,\tilde z)+\omega. \]
\[ \max_\ell (\epsilon zk)^\alpha\ell^{1-\alpha}-w\ell, \qquad R(\epsilon z;w)=\epsilon z\alpha\left(\frac{1-\alpha}{w}\right)^{\frac{1-\alpha}{\alpha}}. \] \[ (1-\kappa)k(a,\epsilon z)\le\lambda(a+\phi\omega), \] \[ y(a,\epsilon z)=\max\{0,\lambda(a+\phi\omega)[R(\epsilon z;w)-r-\delta]\}. \]
\[ \begin{aligned} D&=\kappa\int R(\epsilon z;w)k(a,\epsilon z)\,dg(\epsilon)d\mu,\\ K_g&=\kappa\int k(a,\epsilon z)\,dg(\epsilon)d\mu, \end{aligned} \] \[ \omega+I_g+G_0=T_0+D,\qquad K_g'=(1-\delta)K_g+I_g. \] In steady state: \[ \omega+\delta K_g+G_0=T_0+D. \]
| Parameter | Description | Value | Source / target |
|---|---|---|---|
| \(\chi\) | CRRA coefficient | \(1.5\) | |
| \(\varphi_1\) | Inverse Frisch elasticity | \(2.0\) | Fixed |
| \(q_1\) | Adult equivalence scale | \(2.057\) | Implied by calibrated altruism |
| \(\varsigma\) | Survival probability | \(0.577\) | Life expectancy, National Center for Health Statistics (2011) |
|
|
|||
| \(\alpha\) | Entrepreneurial capital elasticity | \(0.33\) | |
| \(\delta\) | Model-period depreciation rate | \(0.744\) | |
| \(\lambda\) | Collateral constraint | \(2.00\) | Mean entrepreneur leverage, SCF |
| \(\psi_s\) | Earnings shifter | \((1,1.1403)\) | Hourly wage profile, CPS |
|
|
|||
| \(\tau_1\) | Tax progressivity | \(0.20\) | Heathcote, Storesletten, and Violante (2017) |
| \(G/Y\) | Government purchases / GDP | \(18.9\%\) | Heathcote, Storesletten, and Violante (2017) |
| \(r^{ann}\) | Annual safe rate | \(3\%\) | Fixed empirical input |
| \(\omega_0/\bar y^{ann}\) | Benchmark universal transfer / worker earnings | \(4\%\) | Policy benchmark |
| \(\phi_{h0},\phi_{k0}\) | Benchmark transfer pledgeability | \((0.1327,0.1327)\) | Policy benchmark |
| \(p\) | Social Security replacement rate | \(40\%\) | Social Security Administration (2011) |
| \(\tau_a\) | Capital income tax rate | \(0.36\) | Fixed |
| \(\tau_c\) | Consumption tax rate | \(0.05\) | Fixed |
| Parameter | Description | Provisional | Target / role |
|---|---|---|---|
| \(\beta^{ann}\) | Discount factor | \(0.9895\) | Capital clearing at \(r^{ann}=3\%\) |
| \(\tau_0^{ann}\) | Tax level | \(0.9548\) | \(G/Y=18.9\%\) |
|
|
|||
| \(\theta\) | Altruism toward children | \(0.4851\) | Transfers / wealth |
| \(\varphi_{0,s}\) | Labor disutility | \((7.0566,\;14.2298)\) | Mean hours by age |
| \(\zeta_s\) | Entrepreneurship preference | \((-1.1900,\;-0.5124,\;-1.0282)\) | Entrepreneur shares by age |
| \(\sigma_\xi\) | Taste-shock dispersion | \(0.20\) | Fixed provisionally; wealth-entry profile auxiliary |
|
|
|||
| \(\gamma\) | Child investment productivity | \(0.4625\) | Education expenditures / GDP |
|
|
|||
| \(\nu\) | Entrepreneurial returns to scale | \(0.9381\) | Entrepreneur wealth share |
| \(\mu_z\) | Entrepreneurial ability level | \(4.1987\) | Entrepreneurial income share |
| \(\rho_h\) | Intergenerational human-capital persistence | \(0.3875\) | Parent-child income rank slope |
| \(\rho_z\) | Human capital–entrepreneurial ability link | \(0.4500\) | Children’s relative entrepreneurship |
| \(\sigma_\eta^h,\sigma_\eta^z\) | Permanent skill dispersion | \((0.1583,\;0.1583)\) | Permanent earnings dispersion |
|
|
|||
| \(\sigma_s^h\) | Labor-income shock dispersion | \((0.2511,\;1.0015)\) | Lifecycle earnings risk |
| \(\sigma_s^z\) | Entrepreneurial shock dispersion | \((0.6315,\;0.0999,\;0.6315)\) | Business-income dispersion |
| \(\bar y^{ann}\) | Earnings scale | \(2.4398\) | Mean worker earnings |
| Moment | Data | Model |
|---|---|---|
| Mean hours by age (CPS; model units) | \((0.281,\;0.227)\) | \((0.300,\;0.151)\) |
| Common worker-income component SD (DeBacker et al.) | \(1.05\) | \(5.355\) |
| Stage-specific worker-income innovation SD (DeBacker et al.) | \((0.877,\;1.04)\) | \((0.369,\;1.097)\) |
|
|
||
| Entrepreneur shares by age (SCF) | \((8.4\%,\;14.8\%,\;8.3\%)\) | \((0.18\%,\;14.67\%,\;0.85\%)\) |
| Entrepreneur wealth share (SCF) | \(45.2\%\) | \(8.31\%\) |
| Entrepreneur income share (SCF) | \(13.9\%\) | \(19.64\%\) |
| Common entrepreneur-income component SD (DeBacker et al.) | \(2.96\) | \(3.058\) |
| Stage-specific entrepreneur-income innovation SD, projection (DeBacker et al.) | \((3.08,\;4.09,\;4.88)\) | \((0.000,\;0.000,\;1.714)\) |
|
|
||
| Education expenditures / GDP (OECD) | \(5.8\%\) | \(7.04\%\) |
| Transfers / wealth (FEDS) | \(40\%\) | \(5.02\%\) |
| Parent-child income rank correlation Chetty et al. (2014) | \(0.341\) | \(0.603\) |
| Children’s relative entrepreneurship probability | \(1.60\) | \(0.934\) |